|
|
|
IMPACT ON SOCIAL CAPITAL
|
In OECD countries, quality of life has flatlined or worse for several decades.
The average improved, but all the benefit was at the top, leaving nothing for everyone else
|
|
GDP up ... Profits up ... But NOT wages
|

|
As GDP has gone up (red line), labor (green line) has gone up not quite as much, but profits (blue line) have gone up by a substantial amount. What this shows is that all the benefits from 'productivity' have been given to profits and nothing given to labor.
|
|
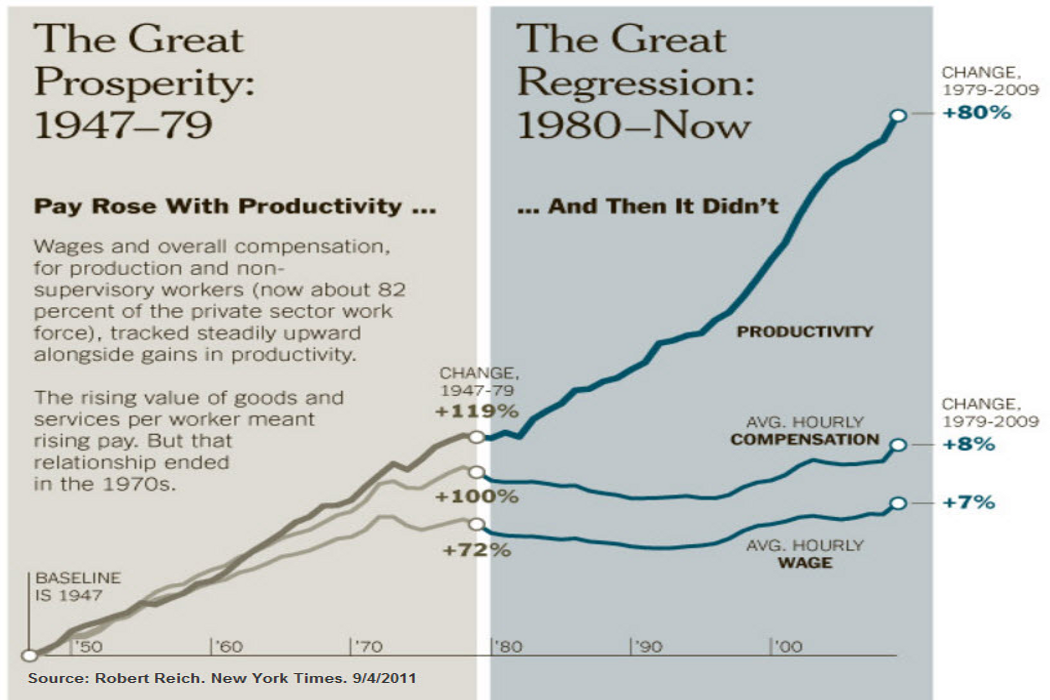
Before Reagan / After Reagan
|
|
This graphic prepared by Professor Robert Reich shows some key economic indicators pre-Reagan and then after Reagan.
For about 30 years post WWII during the 'Great Prosperity' the US economy enabled most Americans to improve their quality of life, but after 1980 when that ended the share of prosperity was much bigger for owners than it was for workers.
|
|
Union membership down ... Inequality up
|

|
Union Membership reached an all-time high by the end of WWII. The proportion of union members remained high after the war, and then declined during the 1960s and 1970s. The decline gained momentum under President Reagan in the 1980s, and this decline has continued up to this time (2019).
Collective bargaining was an important tool for getting a fair balance between labor and management in wage negotiations. Profits were increasing with improved productivity, and collective bargaining meant that the benefit of increased productivity was shared in a reasonably equitable manner.
This being weakened over time as more US States adopted 'Right to Work' laws that made unionization difficult. Companies started to migrate from the unionized North to the less unionized South where wages were lower.
The trend was aggravated significantly with the oil shock of 1973 when the OPEC cartel established a crude oil price of $13.50 a barrel, up from $3.50 a barrel. While major international oil companies could have continued to sell at pre-OPEC prices, they chose to increase prices dramatically, no matter that they had been profitable under the pre-OPEC market conditions. While this was good for the oil companies, it was catastrophic for most of US industry that was labor efficient but chronically energy inefficient. This inefficiency did not matter much when US energy was very cheap, but under the OPEC market conditions, this was no longer the case. In the 1970s post 1973 the US industrial sector was facing a crisis with costs dramatically increased. They increased prices in an attempt to sustain profitability, and the result was record levels of inflation. This was entirely cost push inflation. Not surprisingly, attempts to control inflation using monetary policy were a complete failure.
Inequality accelerated after President Reagan fired striking Air Controllers and American companies moved more and more of their product sourcing to a variety of low wage countries around the world, and to a great extent, to China.
|
|
|
Decline of US Household Wealth
|
|
GDP up ... but not GPI
Gross Domestic Product -v- Genuine Progress Indicator
|

|
GDP has grown and grown and grown ... enabled by financialization and a singular focus on economic performance but not taking into consideration externalities, including those that are very important to quality of life and a sustainable environment. When these are taken into account as they are with GPI (Genuine Progress Indicator), then the improvement disappears.
|
|
Household Debt / Student Loans in the USA
|

|
Student loan debt is the only segment of household debt that has been expanding since the financial crisis of 2008. This graphic from 2010 shows the growth of student debt compared to other components of household debt. Around $100 billion has been added to student debt each year.
|
|
Government Spends Too Much and Taxes Too Little
|

|
The financial management of Government is driven far too much by politics and not enough by economic reality and an optimum use of funds.
|
|
US Consumer Debt Outstanding
|

|
There is the possibility that the state of household finance is worse now (in May 2019) than it was in the runup to the financial crisis of 2008.
|
|
IMPACT ON NATURAL CAPITAL
|
|
... and environmental trends are catastrophic
|

|
CO2 emissions
|

|
CO2 concentration
|

|
Temp v CO2
|

|
Sea level rise
|

|
|
|
|
Climate Change is Real and Accelerating
|
GO TOP
|
|
|

|
ALL the scientific data points to massive changes in the climate situation over the past hundred years AND accelerating
|
|
TPB Note: I had what would now be called a STEM focused education at school and then went on to study engineering at Cambridge. My training was so very different from what it takes to become a lawyer where a strong argument using words can change the outcome. In engineering it is scientific reality that drives the outcome, and no amount of verbal argument can make bad engineering stay together. Thank heavens it is engineers that design and build aircraft, and not lawyers, and especially lawyers who have become politicians!
|
|

|
Temperature rise
Global temperatures are on the rise again as 2016 has been marked as the hottest on record.
|

|
Global Land and Ocean Temperature Anomolies from 1880 to 2016
The temperature rise post 1980 has been continuous ... reflecting the massive increase in scale of industrial activity in the post war years.
|

|
Very long term temperative change ... a period of 10,000 years
The temperature rise in the last hundred years is 'off the chart'
|
|
Correlation and Causality for Temperature Rise
|

|
Global temperature and Carbon Dioxide
The level of carbon dioxide in the atmosphere has increased significantly over the same period 1880 to 2016
|
|
Ice Melt and Sea Level Rise
|

|
Sea Level Rise ... 1992 to 2016
Multiple measures for sea level rise show sea level rise has been substantial in recent years
|

Value of $ down
|
Wages flat
|
CO2 concentration
|
Temp v CO2
|
Sea level rise
|
CO2 emissions
|
|
Decline of Biodiversity
|

|
Sea Level Rise ... 1992 to 2016
Multiple measures for sea level rise show sea level rise has been substantial in recent years
|
|
IMPACT ON ECONOMIC CAPITAL
|
|
FINANCIAL CAPITAL
|
PHYSICAL CAPITAL
|
INTANGIBLE CAPITAL
|
INVESTMENT

|
BULLS

|
BUILDINGS

|
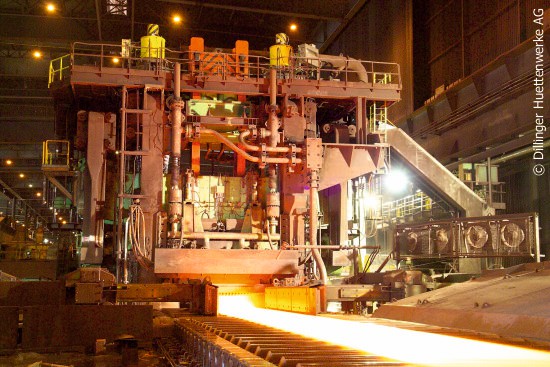
STEEL MFG.
|
SECURITY

|
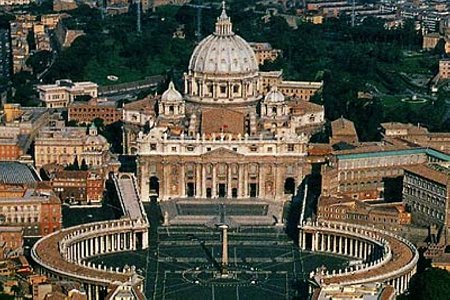
CULTURE

|
THE FINANCIAL ECONOMY / MONEY and LIQUIDITY
Profits, Stock Prices and GDP measure success in the modern economy
|
|
INVESTMENT
|
BULLS
A bull market has been good for investors
|
STOCKS UP

Stock market has been spectacular
|
MONEY BASE

Monetary base has expanded since 2008
|
MONEY

US$ has has massive value loss over time
|
MONEY DOWN
... but the buying power of the US$ is way down
|
WAGES FLAT
and wages flatlining while productivity grows.
|
GDP -v- GPI
While GDP is up, progress (GPI) is flat
|
- The financial economy has grown robustly since the 1980s.
- Amazing innovation has been deployed mainly to improve profit performance.
- The huge expansion of financial wealth is excessivly concentrated.
- Concentration of economic power by both individuals and corporate organizations has come at the expense of everyone else.
- A lot of people are 'mad as hell' and don't intend to take it any more.
|
|
MONEY / LIQUIDITY
|
|
Stock market
|
Intangible value

|
Money supply

|
World GDP growth

|
US GDP growth

|
GDP v GPI
|
|
Without money / liquidity, the system stops working ... or never gets started
|
- The money system is very powerful, and difficult to understand.
- Some commonly held beliefs are wrong.
- It is unclear if any of the proposed better systems would be any better.
|
|
|
Value of $ down
The buying power of money has declined dramatically over time ... likely because of a systemic flaw in how the money system works
|

|
Stacks of 50-subject one dollar note sheets at the U.S. Bureau of Engraving and Printing in Washington on April 14, 2015. (Andrew Harrer/Bloomberg)
|

|
Cut stacks of $100 bills make their way down the line at the Bureau of Engraving and Printing Western Currency Facility in Fort Worth, Texas. (AP Photo/LM Otero)
|
|
UK Bank Lending by Sector from 1997 to 2012
|
|
|
UK bank lending grew along with the size of the British economy from 1997 to around 2007, at which point there was a surge in lending to the financial and real estate sectors ... and a subsequent banking crisis as these loans proved unviable.
What is particularly concerning is that the lending to non-financial businesses ... what one might describe as the 'real economy' which produces the goods and services that we all need to live our lives, has flatlined for this period, as it has done for a very long time before this period.
|
|
Economic and financial metrics going up ...
|
|
|
US GDP growth
|
|
|
World GDP growth
|
|
|
Stock market
|
|
|
Intangible value
|
|
|
Money supply
|

|
Balance sheet cash
|
|
THE REAL (PHYSICAL) ECONOMY
|
|
BUILDINGS
|
INFRASTRUCTURE

|
STEEL MFG.
|
CEMENT MFG.

|
SHIPPING

|
RAILROADS

|
|
Buildings / Infrastructure / Industrial Processes / Transport
|
- Modern engineering and technology is deployed and exploited to improve profit performance.
- Rather little is is deployed to make society and the world a better place.
- The modern 'real' economy is pretty amazing, but not so much in the news (Western news, that is).
- Many of the more amazing things are going on in the Middle East (e.g. Dubai) and Far East (China).
|
|
THE INTANGIBLE ECONOMY
|
KNOWLEDGE

|
EDUCATION

|
GOVERNMENT

|
SECURITY
|
CULTURE
|
RELIGION
|
|
Many of these important things make life worth living
|
- These elements are very important, but metrics for their value are undeveloped.
- The intangible economy is a very important contributor to quality of life.
- Will remain at the margin as long as the dominant performance metric is mainly profit.
|
|
Price of Gold in US$ ... 1960 to 2016
|

|
President Nixon took the US off the 'gold standard' in the 1970s. Since then the price of gold measured in $ money has increased dramatically. But what does this mean? More than anything else it
probably means that modern money should not be trusted ... at any rate, not as a store of value!
|
|
Value of Money ... 1900 to 2000
|
|
|
The purchasing power of the US$ declined dramatically during the 20th century, but this may not be so important because the flow of money through the economy increased by a huge amount as well. What it does mean, more than anything else is that money per se is a very poor way of measuring anything.
|
|
|
|
GDP up ... Profits up ... But NOT wages
|

|
For the period from 1980 to 2015, the bottom 50% of the US population has shared less and less of the total GDP while the top 50% has been increasing its share.
Early in the 1980s President Reagan made it much more difficult for workers to benefit from collective bargaining, and over time profits have increased while wages have not. Not surprisngly, workers are 'mad as hell' and want the situation changed.
|
|
|
|