SOCIO-ENVIRO-ECONOMIC TRENDS
FINANCIAL ECONOMY
These trends have been in place for many years ... but now dominate the system
|
|
|
|
The takeaway from these graphs is that decision makers have been able to make decisions that delivered benefit to owners (investors) while the population that works in the USA has been put to further disadvantage compared to prior decades. This is the result that one must expect as long as the dominent measure of economic success is money profit and money wealth accumulation. It confirms my belief that in order for the economy to be optimized for ALL the population there must be measures to reflect quality of life for everyone, and not merely a single simple measure that really only works for those with affluence.
|
|
GDP, GPI AND QUALITY OF LIFE
|
|
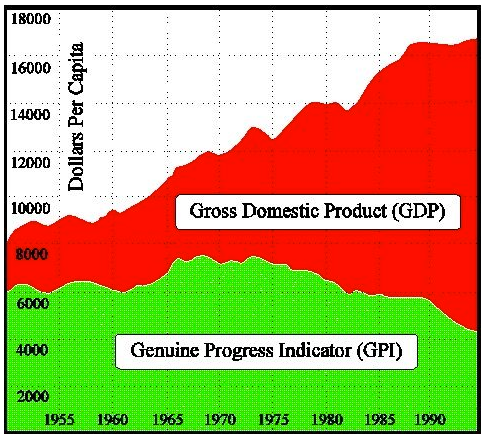
GDP versus GPI
Until the late 1960s there was some correletaion between per capita Gross Domestic Product (GDP) and the Genuine Progress Indicator (GPI), but this ended with the economic downturn of the ealry 1970s, the subsequent oil shock of 1973 and subsequent stagflation and cost push inflation. After 1980, there was a new political imperative where deregulation and profit became the dominant policy rather than a more balanced set of socio-economic goals.
The cost push inflation of the 1970s was ended in large part by the expansion of offshore manufacturing espcecially in China and reduction of high wage US manufacturing.
|

|
Corporate profits, GDP and labor wages
For the period 1970 to 1985 corporate profits were relatively stagnant, but from 1985 to the present profits have increased significantly though with substantial volativity.
GDP has increased modestly year over year while labor income has increase rather less.
|

|
Productivity up ... Wages down!
A plot of productivity versus wage growth shows that NONE of the benefit of increased productivity has gone to improving wages ... ALL of it has gone to profits and to the benefit of owners.
|
|
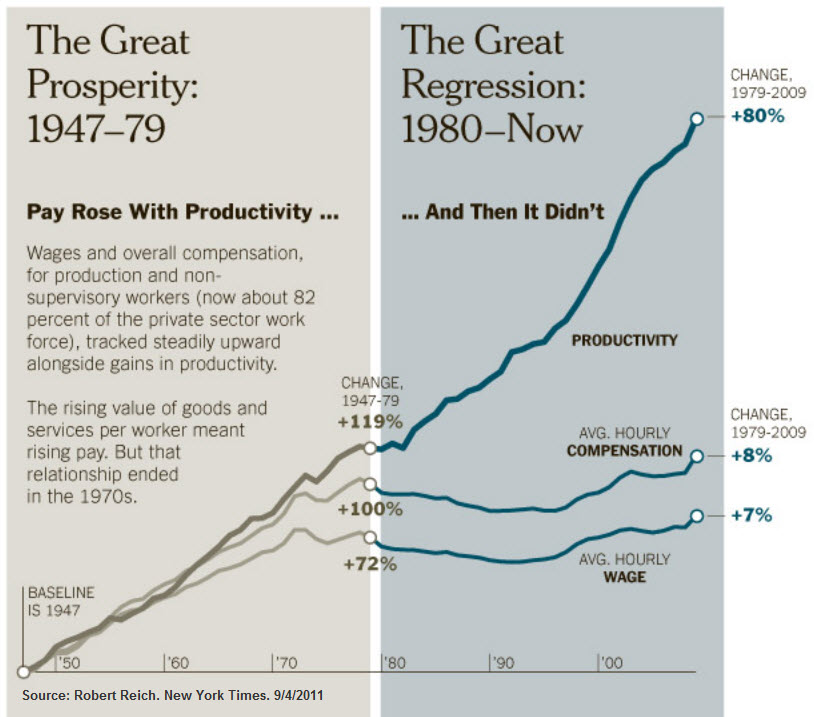
Productivity up ... Wages down!
This graphic prepared by Secretary Reich shows the same basic information.
For more than 30 years all the benefits of improved productivity has gone to owners, with none going to those that work.
In the period 1945 to 1980 the growth of productivity was share more equitably between investors and workers.
|

|
This set of data (from Andrew McAfee) shows a modest growth in GDP for the USA from 1995 to 2011. In this period corporate investment increased but dropped as the economy went into a short recession after the post Y2K tech boom and again in the so called 'great recession' of the period 2007/8/9.
Non financial profits after tax has grown stongly from 1995 to 205 but with signficiant fluctuations with big drops in the 2000 recession and again in the great recession a few years later. Total profits after tax did not fluctuate as much as the financial sector fluctuated less even though it had a huge role in the financial crisis that was responsible for the great recession.
None of these economic indicators suggests an economy and a society in trouble ... rather it looks like a set of trends that are really quite good.
|
|

|
The problem is that when the productivity / worker trends are added in (the red line) then it shows that the achievements of the economy are being obtained with less and less participation of workers. It comes as no surprise that a political candidate such as Donald Trump is able to attract votes based on a promise of change, when a very large proportion of the country's worklers are 'losing' relative to the more advantaged in the society.
This is very basic economic analysis that seems to have been ignorded by politicians, policy makers and the media for a very long time.
|

|
Financial Sector Assets
A big part of the wealth of the United States has been created not so much by the ownership of physical assets, but by the ownership of financial assets.
|
|
MONEY ... THE DECLINING DOLLAR
|
|
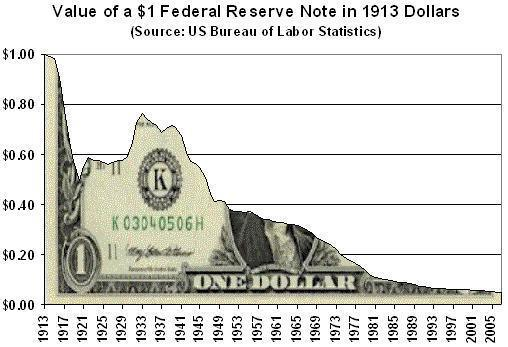
The declining value of the dollar
Some economists attribute the decline in value of the dollar to the creation of the Federal Reserve Bank.
It is possible to ascribe correlation to this, but not causation.
|

|
The declining value of the dollar
More likely is that the decline in the value of the dollar is attrributable to the changes that have ossurred in the underlying economy of the United States and the World.
There have been substantial drops in the value of the dollar during the First World War and the Second World War. In both cases there was massive 'inflation' caused by excessive demand for war materials ... demand pull inflation and production profits.
Global production profits have continued to fuel demand pull inflation since the 1980s. During the 1970s following the global 'oil shock', there was cost push inflation.
|
|
INTERNATIONAL DEVELOPMENT
|

|
Funding Development Assistance
The changes in the structure of development financial flows over the past 40 years mean that developing countries are going to be less and less able to achieve independent sustainability. This outht to be a matter of great concern, but the discussion is muted.
Official Development Assistance (ODA) has remained at about the same level of several decades.
However, various forms of debt financing and foreign direct investment have increased substantially. The expectation with these modes of financing is that there will be a 'return' from these investments that is a risk adjusted market rate. In most cases this will be substantially more than the underlying increase in the productivity and performance of the economy ... and the basic arithmetic is that the country gets pooer rather than richer as a result of the financial interevention.
The good news is that international remittances have grown substantially. These fund flows have a very positive impact on the quality of life of the beneficiaries. Sadly remittances are also the target of politicians who have an interest in taxing these fund flows.
|
US GDP
All profits after tax
Non-financial profits after tax
Corporate Investments
|
|
|


