|
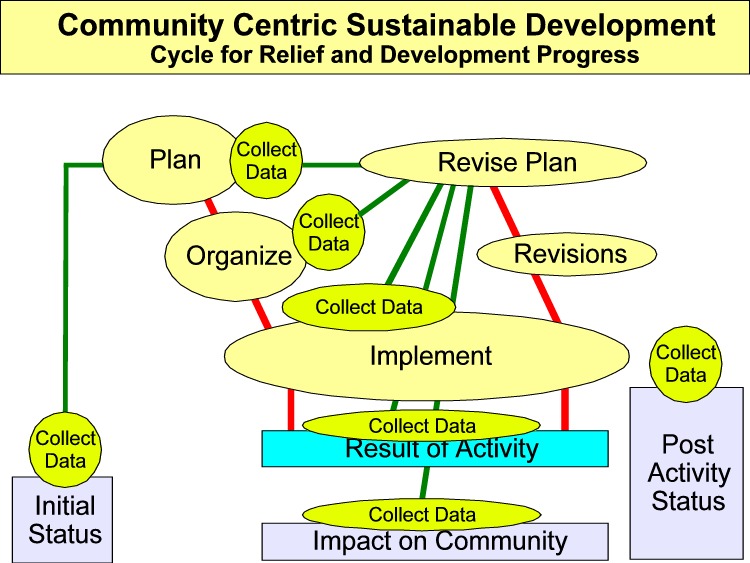
Data are critical to decision making ... and the management process. The following graphic puts data at
the center where it may be used for planning, for organizing, for implementation and then the
measurement of the activity and its impact on the community. Overall, data may show the change from
pre implementation to post implementation and address the question of how much progress there was, and
how much it had cost.

Data needs to be at the center in order to be most effectively used. At one time data at the center had the
potential to be a serious constraint with the key operating entities starved of what they need to know, but
that should not happen in a modern information system.
The same facts should be used for everything ... and the data should be representative of facts. There
might be different levels of detail ... but the essential underlying facts are the same.
And it might be advantageous to have different levels of detail so that it is easier to make decisions ... but
again the underlying facts are the same.
Data are not only at the center, they are ubiquitous.
Data are needed to measure and manage the performance of everything.
How do you measure
It usually is very easy to know what to measure if two things are known:
- what are the goals or objectives; and
- what is the technology or science that is or may be used. Measure what is. Simply put ... measure what makes sense.
How to measure
Cost is easy. Price is easy. Value is more difficult ... and all the more reason for having it central to the analysis system, and being able to prepare reports that look at results from different perspectives. TVM Value Accountancy uses a system of standard values to quantify impact and everything to do with value.
What does measurement tell you
The first thing is that what is measured is often what you are trying to do ... so when activities are measured and not impact, it can be concluded that the activities have priority over results. This is a widespread problem that TVM Value Accountancy addresses.
////////////////
Data collection workbooks are used so that data collection is very efficient using the relational model, and for efficient data acquisition using mobile phone SMS data transmission. Technology for data collection is advancing into the 21st century ... but the mindset about using data for important things remains in the stone age! People change slowly! There are many possibilities for the use of technology to help with data collection ... and what is used should be what is most cost effective. The best technology from the technical standpoint is usually not the most cost effective.
| 