OVERVIEW
MANAGEMENT
PERFORMANCE
POSSIBILITIES
CAPITALS
ACTIVITIES
ACTORS
BURGESS
Economic Trends, Society and Economy |
|
COMMENTARY When engineers make mistakes it is pretty obvious ... the bridge falls down or the aircraft does not fly. When economists make mistakes people suffer but nothing actually falls down ... same for accountants. The ideas that are being described by Cesar Hidalgo of MIT and Ricardo Hausmann of Harvard and now published in an Atlas are an academic version of advanced common sense used every day for decades by sensible business people. So it is good to see common sense being embraced by academics, but it still begs the question of how powerful decision makers are going to make use of this to create the right sort of incentives for a global society that is sustainable, efficient and just. One of the issues that is completely missed by analysis of this sort is the very human dimension of corruption in high places ... both corporate and governmental that ends up highjacking the potential for socio-economic progress for the country in exchange for self serving interests. The so-called 'enabling environment' of a location is a huge factor in whether investments will be successful or not.
I see an opportunity for these ideas to be combined with the foundation concepts of TrueValueMetrics to provide a 21st century decision making process and equally important, a system to measure performance and provide accountability.
|
|
Aid on the Edge of Chaos ... Exploring complexity & evolutionary sciences in foreign aid ... What Does The Atlas of Economic Complexity Mean for Development? Ricardo Hausmann of Harvard and Cesar Hidalgo of MIT (whose work I have blogged about previously here) have just published the deeply impressive Atlas of Economic Complexity. It is built around an innovative, network-based methodology for understanding economies and their potential for growth. It represents perhaps the most systematic and in-depth application of the ideas and methods of complexity research to issues of development to date. Following an interview with Cesar Hidalgo last week, this extended post explores the implications of this important new work. I. What is the premise of the Atlas? The basic idea underpinning the Atlas of Economic Complexity is straightforward. As Hausmann notes: The fundamental proposition… is that the wealth of nations is driven by productive knowledge. Individuals are limited in the things they can effectively know and use in production so the only way a society can hold more knowledge is by distributing different chunks of knowledge to different people. To use the knowledge, these chunks need to be re-aggregated by connecting people through organizations and markets. The complex web of products and markets is the other side of the coin of the accumulating productive knowledge. [emphasis added]At the heart of the Atlas is the attempt to measure the amount of productive knowledge that each country holds by applying network analysis techniques to this complex web. Much standard development – and economic – thinking doesn’t engage very well with the idea of webs and networks. As Hidalgo told me, such ideas run counter to much standard thinking, which seeks to identify differences between individuals and groups based on their inherent qualities – demographic criteria and suchlike. Experts then puzzle over why, for example, communities with the same criteria, or countries with very similar starting points end up with very different development pathways and social and wealth outcomes. It turns out that in many cases, their relationships and networks prove to be a key differentiating factor. If the data is available, it is possible to develop very precise and rigorous analysis of these differences. II. How does the Atlas work? So how does the Atlas make these ideas relevant to development economics? Well, for starters, it acknowledges that accumulating productive knowledge is difficult: “For the most part, it is not available in books or on the Internet. It is embedded in brains and human networks. It is tacit and hard to transmit and acquire. It comes from years of experience more than from years of schooling. Productive knowledge, therefore, cannot be learned easily like a song or a poem. It requires structural changes. Just like learning a language requires changes in the structure of the brain, developing a new industry requires changes in the patterns of interaction inside an organization or society.”As readers will be well aware, the social accumulation of productive knowledge has not been universal: “The enormous income gaps between rich and poor nations are an expression of the vast differences in productive knowledge amassed by different nations.” These differences are expressed in the diversity and sophistication of the things that each nation makes. In order to put knowledge into productive use, societies need to reassemble these distributed products through teams, organisations and markets. These issues are explored in detail in the Atlas, through the concept of the ‘product space’. This is a map which captures the products made by different countries in terms of their knowledge requirements. This maps provide a way of understanding how productive knowledge is accumulated. As Hidalgo said in interview: Knowledge doesn’t add up like capital. There is a lot of redundancy in knowledge. Some countries may have diverse knowledge but small populations. Product space is an expression of different kinds of knowledge – and its much better than other indicators.Cesar’s TED talk from August 2010 gives more information about this idea and how it works.
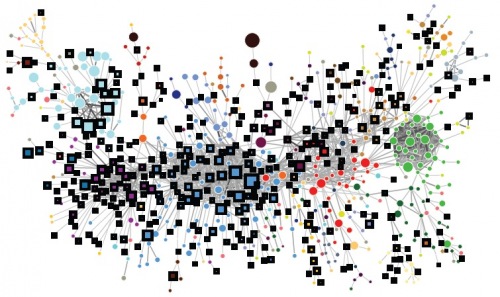
The underlying notion of this analysis is that the complexity of an economy is related to the range of useful knowledge embedded in it: For a complex society to exist, and to sustain itself, people who know about design, marketing, finance, technology, human resource management, operations and trade law must be able to interact and combine their knowledge to make products. These same products cannot be made in societies that are missing parts of this capability set. Economic complexity, therefore, is expressed in the composition of a country’s productive output and reflects the structures that emerge to hold and combine knowledge… Increased economic complexity is necessary for a society to be able to hold and use a larger amount of productive knowledge, and we can measure it from the mix of products that countries are able to make.”III: What does it all mean? So what does this give us in practical terms? As a starter, representing such a huge amount of data – covering 128 countries, 99% of world trade, 97% of the world GDP and 95% of the world population – in visual form is in itself a remarkable feat. As people like Hans Rosling have powerfully demonstrated, innovations in how we visualise data can yield tremendous new insights and ideas. Here’s an example of a product space diagram, this one for the United States. To learn more about the diagrams and how to interpret them, I would strongly recommend having a play with the visualiser, then scanning the report, then having another play.
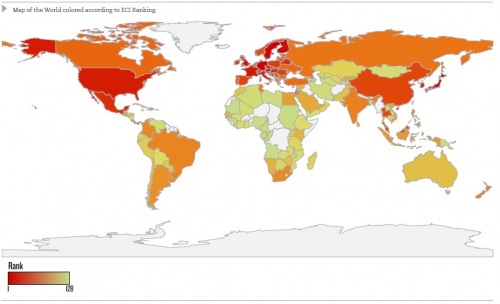
Hausmann, Hidalgo and their team have also developed an Index of Economic Complexity to represent their data systematically. This Index tells us about the richness of the product space of a given country, and by extension, is one useful indicator of the potential to grow. It can also be used to compare economic complexity across countries, as shown in this chart showing the ranking of different countries (from 1 to 128, highest is most red).
The authors acknowledge that these ideas are not always easy to grasp, and provide a useful thought-experiment to help readers get their heads around the implications of the Index. Think of a particular country and consider a random product. Now, ask yourself the following question: If this country cannot make this product, in how many other countries can this product be made? If the answer is many countries, then this country probably does not have a complex economy. On the other hand, if few other countries are able to make a product that this country cannot make, this would suggest that this is a complex economy.So for example, Japan and Germany are the two countries with the highest levels of economic complexity and if a good cannot be produced there, the list of other potential countries is likely to be very short. Conversely if a product cannot be made in Mauritania or Sudan, the list of other potential countries is likely to be a long one. One useful way of understanding the benefits of the Atlas is to think about what the analysis adds to some of the key questions in growth economics. One of the classic comparisons made in the growth literature is between African and East Asian countries – which were at comparable levels of development in the 1950s-1970s, but which are now literally worlds apart. Hausmann and Hidalgo give their take on this by comparing the Economic Complexity Index for Ghana and Thailand. The lessons are resonant for aid agencies. Both countries had similar levels of schooling in 1970, and Ghana expanded education more vigorously than Thailand in the subsequent 40 years, supported of course by external assistance and policy recommendations. Despite this, “Ghana’s economic complexity and income stagnated as it remained an exporter of cocoa, aluminium, fish and forest products. By contrast, between 1970 and 1985 Thailand underwent a massive increase in economic complexity, equivalent to a change of one standard deviation in the Economic Complexity Index. This caused a sustained economic boom in Thailand after 1985. As a consequence, the level of income per capita between Ghana and Thailand has since diverged dramatically.” The Economic Complexity Index has been shown to be a better predictor of economic growth than a number of other existing development indicators. For example, as reported in the Economist last week, it outstrips the WEF index of competitiveness by a factor of 10 in terms of the accuracy of its predictions. It also outperforms the World Governance Indicators and the standard variable used to measure human capital as predictors of growth. There are many other rich and varied insights from the work which cannot be covered in detail here. There is also tremendous potential to build on and extend this data and analysis in the future. One of the areas I have been working on recently is on resilience, both as a means of reducing the impact of future crises and disasters, and as a means of securing development gains. This issue is understandably at the forefront of many policymakers’ minds at the moment. The network analysis underpinning the Atlas could be used as a very useful comparative indicator of economic resilience, comparing the sustainability of growth in different countries, and help us think through growth scenarios which might enhance or diminish resilience. There may also be scope to use this kind of thinking to bring more rigour and realism to problems of industrial reform. Take for example the ubiquitous issue of how we move to low-carbon industrial strategies. It would need more data and analysis, but the product space is clearly a powerful way to start to think about the key issues in a systematic and data driven fashion. There are numerous climate change benchmarks out there but none – as far as I know – employ the kind of network analysis used in the Atlas, and so a key aspect of how industrial economies work is missed out. By understanding better the carbon reliance of a particular countries product space, it is possible to think through the implications – the likely successes and failures – of existing adaptation policies. IV: In conclusion Perhaps the most important contribution of the Atlas is the analytical rigour that it brings to the complex and dynamic nature of economic growth, and the ability it gives us to ask new and challenging questions more precisely. Cesar summed it up for me as follows: What we really want to do is to inspire a new kind of conversation. Our traditional approach to economics has retained measures developed in 1930s and 1940s to deal with the situations and crises we faced back then. We think there should be a new breed of measures – that bring much more precision and resolution, and that mean we don’t continue to build our analysis on the over-simplification of a complex system.Let’s hope we see more of this way of thinking in development debates. While there will inevitably be a degree of resistance from the old guard, it seems to me that the underlying premise of the report is something that no one could disagree with: Ultimately, this Atlas views economic development as a social learning process, but one that is rife with pitfalls and dangers. Countries accumulate productive knowledge by developing the capacity to make a larger variety of products of increasing complexity. This process involves trial and error. It is a risky journey in search of the possible.” Such lessons clearly need to play a much more central role in development policy and practice. Haussman, Hidalgo and their team have done us a real service with this work. COMMENTS ... RESPONSES on November 7, 2011 at 2:26 pm | ReplyFaly Ranaivoson I appreciate how this network-based methodology brings a new lens or perspective to the whole issue of development. However, where I remain unsatisfied is that it does not say much – or at least it is my impression – about what is it that allows a country to develop the capacity to make a larger variety of products of increasing complexity in the first place. What struck me though – and maybe there are hints of answers to my interrogation there – is this particular passage about productive knowledge: “For the most part, it [productive knowledge] is not available in books or on the Internet. It is embedded in brains and human networks. It is tacit and hard to transmit and acquire. It comes from years of experience more than from years of schooling. Productive knowledge, therefore, cannot be learned easily like a song or a poem. It requires structural changes.” This struck me because I find it links with what developmental psychologist Robert Kegan writes about in his “In Over Our Heads” book. He makes a key distinction between what we know (or content) and how we know (or ways of knowing). And to me it seems the concept of productive knowledge would link to the latter. Seems like an interesting area for further investigation… on November 8, 2011 at 10:57 pm | ReplyBrianSJ3 The dynamics of this are potentially interesting vis a vis Tainter’s theory of collapse i.e.
on November 9, 2011 at 10:28 am | ReplySøren Hi Ben, thanks for posting. I agree that Hausmann and Hidalgo’s work is really interesting! When ever I read their work, however, I wish they would look a bit more into if there is a tipping point, where economies or organisations go beyond the edge of chaos. Is that something you asked Cesar about? However valuable I think their work is, I’m worried that they have a few self-selection problems, in that they tend to go from the end product to the under suppliers, as their thought example illustrate, rather than from the fragments and inwards. Consequently, they actually end up with a quite a linear relationship between complexity and prosperity. My own work on communities’ abilities within community-based public service provision has some similarities to their analysis but I find a different picture. So far, the data shows a relationship where the relationship between complexity and ‘effectiveness’ is neatly positive up until a breaking point around the average after which the relationship appears to become random. Well sorry, I didn’t intend to blow my own trumpet like this. I’ve just always wanted to ask them about this. on November 9, 2011 at 10:35 am | ReplyVisuals: Maps & Mapping (1) | Dr. JAH [...] Hausmann of Harvard and Cesar Hidalgo of MIT Link: From @TimHarford link to http://aidontheedge.info/2011/11/03/the-atlas-of-economic-complexity/ 2) Map of Twitter Langauge Use Pretty. Source: Mike McCandless & Eric Fischer , via [...] on November 10, 2011 at 12:00 am | Replyrick davies Hi Ben Re your comment “One of the areas I have been working on recently is on resilience, both as a means of reducing the impact of disasters, and as a means of securing development gains. This issue is understandably at the forefront of many policymakers’ minds at the moment. The network analysis underpinning the Atlas could be used as a very useful comparative indicator of the resilience of growth in different countries, and help us think through growth scenarios which might enhance or diminish resilience.” I wonder if an equivalent/analogous measure of complexity (based on relationship analyses) can be found to apply at the level of organisations and individuals? regards, rick davies on November 11, 2011 at 3:17 pm | Replyvisualign Good summary of the Atlas of Economic Complexity. I recently discovered it myself and blogged about it on my Data Visualization Blog here: http://visualign.wordpress.com/2011/11/10/the-atlas-of-economic-complexity/ In the context here it might be interesting to consider how increasing globalization affects countries abilities to produce. we know that capital is very fluid and transnational. As the Atlas shows, knowledge and capabilities for production are equally important, but probably somewhat less mobile, since people and infrastructure can’t be moved as easily as capital. Increased online collaboration and virtual teams may change this picture to some degree. Then the diffusion of one country across the product space over time will also depend on its foreign policies such as immigration and tax incentives… on November 16, 2011 at 9:01 am | ReplyFrom Poverty to Power by Duncan Green » Blog Archive » Who’s publishing what they give? Complexity, development and the euro crisis; companies v governments; China and Zambia; the Queen v earth summit; climate finance; denial tango: Link [...] a huge amount – I think this is probably v important, but while I’m trying to digest it, have a look at Ben Ramalingam’s post. And while we’re on complexity, what does managing forest fires and other ecosystems tell us [...] on November 23, 2011 at 6:19 pm | ReplyThings to Read » Modern Mythos Media [...] Exploring The Atlas of Economic Complexity « Aid on the Edge of Chaos [...] on December 3, 2011 at 12:44 am | ReplyMeasuring and Visualizing Economic Complexity « Dart-Throwing Chimp [...] Here’s a nice blog post from Aid on the Edge of Chaos that goes into much more detail on what the atlas [...] |
|
by Ben Ramalingam
November 3, 2011 |
| The text being discussed is available at http://aidontheedge.info/2011/11/03/the-atlas-of-economic-complexity/ |