OVERVIEW
MANAGEMENT
PERFORMANCE
POSSIBILITIES
CAPITALS
ACTIVITIES
ACTORS
BURGESS
Metrics |
|
Burgess COMMENTARY |
|
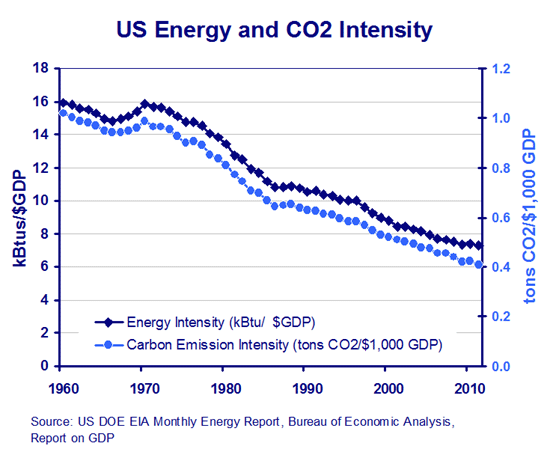
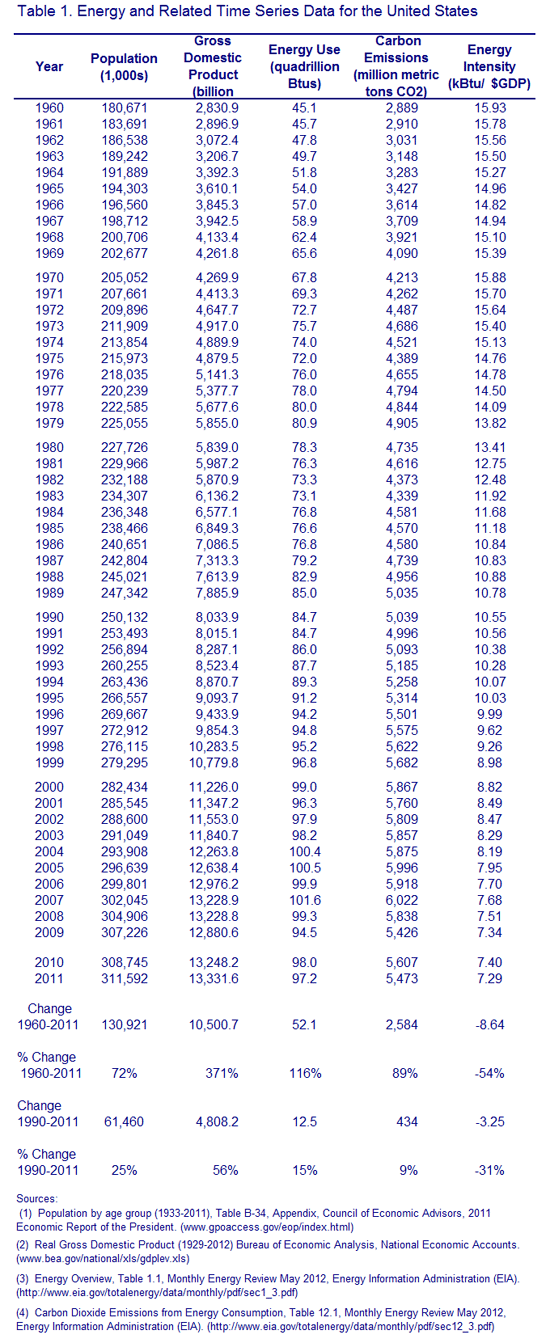
Energy is the lifeblood of the economic process. It provides light, heat and air conditioning for homes, schools and businesses. It powers office equipment and production machinery, and it supports the transports of people and freight. Energy, especially in the form of petroleum resources, is also a critical ingredient in a diverse mix of consumer goods, ranging from medicine and children's toys to food and clothing. But the inefficient use of energy can act like a brake on the economy, contributing to growing pollution and economic slowdown. In addition, most of today's energy sources result in the emission of carbon dioxide (CO2), a significant contributor to the problem of global climate change. The Calvert-Henderson Energy Indicator is one of the keys to understanding the overall efficiency of an economy. Economic activity in the United States, measured as Gross Domestic Product (GDP), has been growing steadily since 1960. At $13.3 trillion dollars, the US GDP is 360% higher than it was in 1960. Despite the growth, the U.S. now requires less energy per dollar of GDP than it did in 1960 with a corresponding reduction in emissions of CO2 per dollar of GDP.
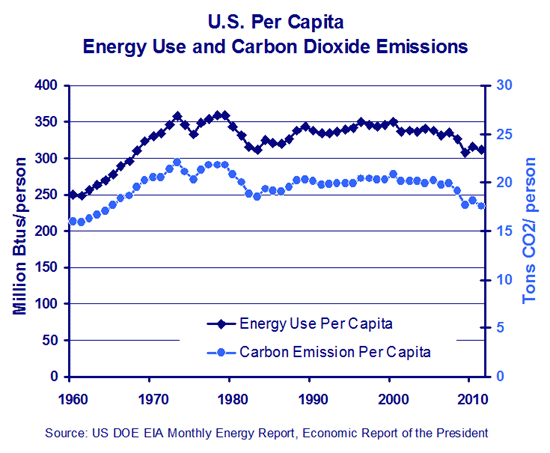
In addition, although the population in the US increased 72% from 1960 to 2011, the per capita energy use and carbon emission has only increased 25% and 10%, respectively, during that time as seen in the graph below. Most of the per capita increase was between 1960 and 1975. The per capita amounts have been relatively stable from 1980 to 2011.
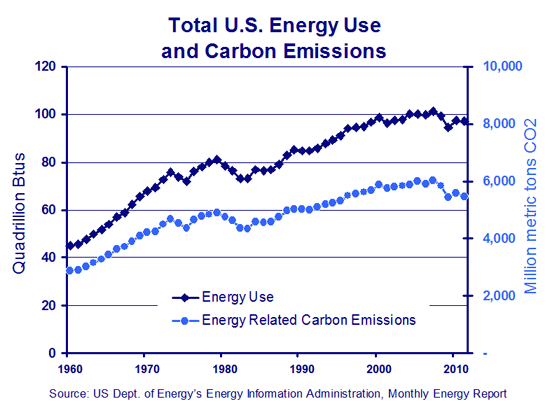
What this means is that inefficient use of energy still defines a significant portion of U.S. economic activity. This is especially true for transportation and electricity production systems. For example, for every kilowatt-hour of electricity that we consume in the United States, two kilowatt-hours are wasted in the form of heat that is dumped into the atmosphere and waterways. That level of inefficiency has been largely unchanged since the 1960s. What we waste in the production of electricity is more than Japan uses to power its entire economy! The net effect of this inefficiency, given the growth in both the GDP and the population of the US, is that the total amount of energy being used and the corresponding CO2 emissions have increased 116% and 89% respectively since 1960 as shown in the graph below.
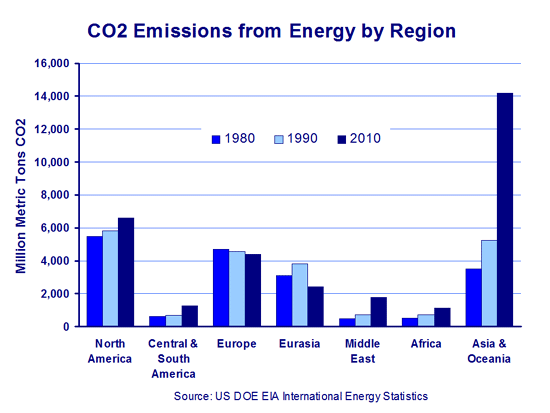
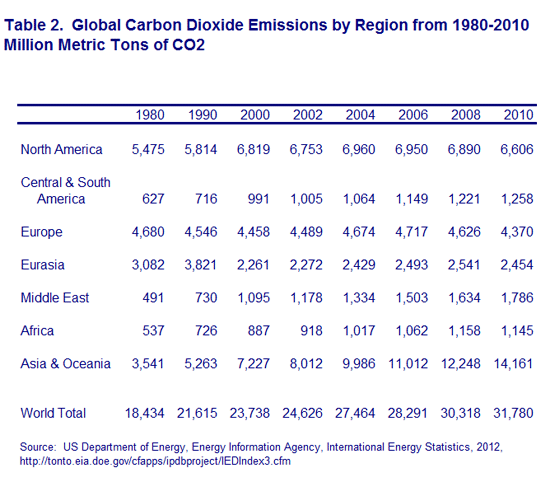
The reliance on relatively inefficient cars, electricity production, and other conventional technologies wastes resources that might otherwise be used to strengthen the nation's competitiveness. Moreover, scientific evidence points to the need to reduce the use of fossil fuels so that we can substantially reduce CO2 emissions now shown to contribute to global climate change. The Calvert-Henderson Energy Indicator demonstrates how energy efficiency can mean less waste, higher profits, more comfortable homes, less polluted communities, and less reliance on foreign sources of energy in the future. The energy use and CO2 emissions of the developed nations like the US has historically accounted for a significant percent of the global issue. The graph below shows total CO2 emissions from different regions of the world. Those areas like North America and Europe accounted for 72% of global CO2 emissions in 1980 as shown in the next graph. That has been changing in the past 25 years, however, as less developed nations have adopted the energy-inefficient methods of the developed nations in order to grow their economies and improve quality of life for their citizens. As shown in the graph below, CO2 emissions in Asia/Oceania increased 300% since 1980 and in 2010 accounted for 44% of the total world CO2 emissions, compared to less than 20% in 1980.
However, quality of life is not directly related to energy use and CO2 emissions. A number of developed countries have managed to maintain or improve quality of life while reducing energy use and CO2 emissions. For example, as the figure below shows, on a per capita basis, life in France, Sweden and the UK requires between 35% to 47% of the CO2 emissions as in the US even though quality of life in those three countries is similar to US quality of life. In addition, all three countries have made greater progress than the US in reducing CO2 emissions since 1980. In particular, Sweden has decreased per capita CO2 emissions by 30% since 1980, compared to only a 14% decrease in the US. The troubling news is that countries like India and China have both nearly tripled their CO2 emissions in the same time frame. Although their per capita emissions are still less than a third of the US per capita, given their much larger populations, if both these countries achieve economic growth through energy-inefficient means, the total world CO2 emissions will skyrocket in the next 10-20 years.
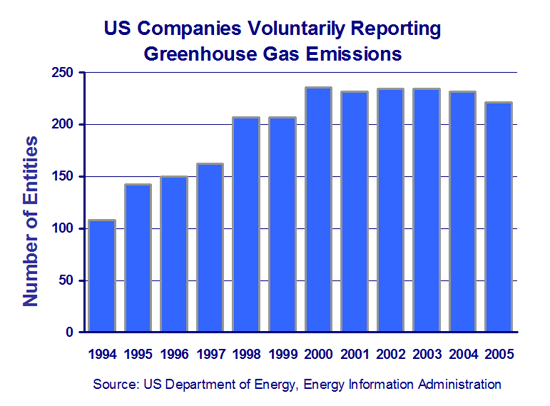
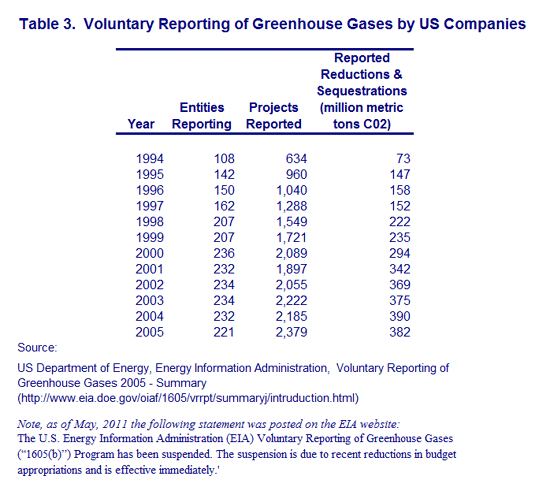
Companies in the US are beginning to respond to the challenge of reducing energy use and carbon dioxide emissions as can be seen in the number of entities that are choosing to voluntarily report greenhouse gas emissions and the efforts they are making to reduce them as shown in the figure below.
More and more companies are working on these issues because they understand the importance of being responsible corporate citizens. It is nearly impossible for any company to have zero environmental impact-in most cases, even turning on the lights is a source of greenhouse gas emissions. Good corporate citizens recognize this, and take steps to monitor and mitigate their environmental impacts. In some cases, those steps can save money, as many energy efficiency or pollution prevention programs do. In others, good environmental stewardship is an important step toward limiting longer-term liabilities that may not, in the short run, show up in financial filings. This long-term view is especially important to socially responsible investors, a growing force in the investment world. The vast majority of professionally managed socially responsible investment (SRI) funds use environmental screens to distinguish corporations that are thoughtful stewards of the environment from those that fail to embrace environment as a core business function or in the worst case, treat the environment as a wastebasket for the by-products of their own production. This is the case with the Calvert Group, one of the leaders in the SRI field and a partner in the Calvert-Henderson Quality of Life Indicators. Julie Fox Gorte, the Director of Calvert Group's Social Research Department says: 'As a long-term investor, Calvert believes that careless treatment of the environment will eventually come back to haunt companies, and more thoughtful programs and minimal impacts will eventually become assets for those that are proactive. We consider where materials and energy are sourced and look for companies that invest in technological and design innovations that reduce pollution and save energy without compromising product or service performance. 'Even for companies that are not major consumers of energy, there are often many opportunities to reduce the energy used, improve energy efficiency, or use less environmentally damaging forms of energy. We have seen many examples of companies that implement zone lighting systems in warehouses, construct buildings with planned access to natural light to cut down on electric lighting, design products to be more energy-efficient, procure renewable energy, or take other steps to manage their energy footprint, and most of these examples come with cost savings as well as mitigation of environmental damage. In addition, corporate attention to environmental and energy management is also indicative of thoughtfulness and care in corporate governance, and we believe mindfulness of energy and environmental, as well as other social, issues is an indicator of good corporate governance in many cases.'There is still progress to be made in making our economy and society more energy efficient, as described in the presentation by John 'Skip' Laitner (see link below). Historical data can be found in the tables below. Presentation by Jim Harding to the European Parliament, January 2008: The Myths of Nuclear Renaissance Presentation by John 'Skip' Laitner at International Energy Agency, April 2004: How Far Energy Efficiency:Practical Limits or Policy Choices? Table 1. US Energy and Related Time Series Data
Table 2. Global CO2 Emissions by Region from 1980-2010
Table 3. Voluntary Reporting of Greenhouse Gases by US Companies
|
|
|
| The text being discussed is available at http://www.calvert-henderson.com/energy.htm |
