|
Consumer Products and Services
To maintain the environmental quality of life in a community and protect the natural capital it relies on, every member of the community must do his or her part. Most people know they shouldn't litter and they should recycle. But the primary way people affect the environmental quality of their community is related more to what products they use and how they treat the land around them. By products, we mean everything from simple everyday objects like newspapers, food, and clothing to larger items like cars, houses, roads, bridges, and other community infrastructure.
This section looks at consumption of products before the final disposal. Other topics related to community infrastructure are discussed in other sections of this indicator:
The amount of trash generated is discussed in the Waste section
The environmental effects of transportation and land development are discussed in the section on Industry and Infrastructure
The manufacturing and transport of products and services affect the environment in a number of ways. The effect can be measured in terms of the material requirements and ecological footprints:
The material requirement is the total amount of raw material required to provide goods and services.
An ecological footprint is a measure of the amount of the earth's biological capacity needed to produce all the goods and services that a person uses
.
These measures are discussed below, followed by a look at how we are changing our buying habits to reduce our impact on the environment.
Material Requirements
When we extract raw materials such as metals, minerals, and fossil fuels from the earth, we generate waste materials at the mining or drilling site. Harvesting renewable resources such as food, fiber, and wood can cause soil erosion and other environmental damage. Moving the raw materials to factories and the finished products to the consumer requires vehicles, roads, and fuel, along with buildings from which to sell the goods and services.
According to a 1997 report by the World Resources Institute, supplying the yearly needs of an average United States citizen required about 85 metric tons of material in 1993. This was a decline from about 100 metric tons per person in 1975. These figures were based on an average of 300 kilograms of material for every $100 of Gross Domestic Product.1
Ecological Footprint
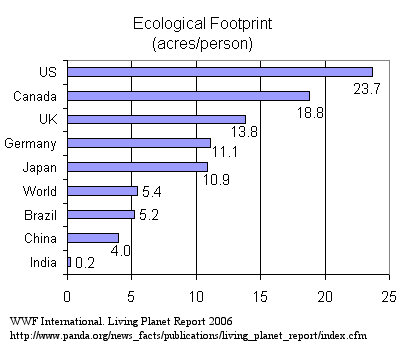
The Ecological Footprint is a measure of how much of the earth's biological capacity is used to support a person's lifestyle, including producing the food and material to keep the person fed, clothed, and housed. (To calculate your own ecological footprint based on your lifestyle, see the links in our Environmental Indicators efforts section)
The graph below compares the ecological footprint for different countries and shows the world average. The footprint of the average US resident is 23.7 acres, nearly 5 times larger than the world average. 2
 Earth's Biological Capacity
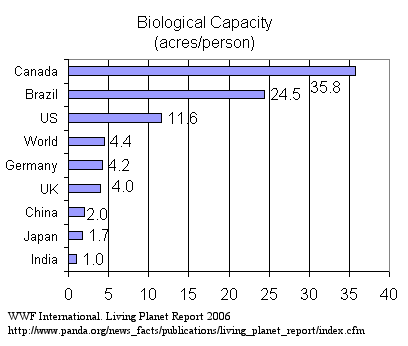
The complement of the ecological footprint is the biological capacity of the earth to provide the things that support human life. A country's biological capacity depends upon factors such as climate, types of soil, and the annual rainfall. Canada and Brazil are very large in terms of land area and the population of both countries is smaller than the US population so their biological capacity per person is two to three times larger than the US. China has a very large amount of land but also has over 1 billion people so China's per person biocapacity is much smaller than the US. The graph below shows the biological capacity of different countries on a per person basis.3
 Since no individual in the United States lives completely off land that he or she owns, it isn't possible to estimate a personal biological capacity. Instead, biological capacity is calculated at a national level, based on the types and quality of the ecosystems contained within the countries borders. Since we live in a global economy, many of the resources used in a country often come from outside that country. That means a country's ecological footprint can be larger than its biological capacity.
Ecological 'Endowments'
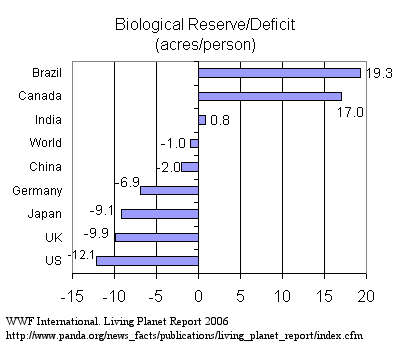
A country's biological capacity is like a person's financial endowment or inheritance. Just as a person's financial endowment can be maintained or spent down over the person's lifetime, so, too, countries' ecological endowments can be maintained or used up. Calculations for ecological footprint and biological capacity show that most countries in the world are spending their natural capital at an alarming rate.4
The graph below shows the extent to which some countries are preserving or spending their biological capacity. Countries with a positive number, such as Brazil, Canada, and India, have economies that currently operate within their biological capacity. Countries with a negative number, such as the US, Japan and China, have economies that exceed their biological capacity. These countries are using up their ecological endowments - if they were companies, this would be called 'operating at a loss'.
 See our section on other Environmental Indicators efforts for more information about work that has been done to measure the ecological footprint at smaller scales such as regional and community.
Organic and Local Food
The food we consume is one component of our ecological footprint and material intensity. One measure of the extent to which food production uses environmental resources is food-miles: the average number of miles that food travels from where it is grown to where it is served. The farther food travels, the more fuel is used to transport it. The Worldwatch Institute estimates that in the United States in 2002, food traveled between 1,500 and 2,500 miles from the farm where it was produced to the place where it was eaten. This was an increase of 25% since 1980.5
Another issue is the extent to which sustainable agricultural practices are used in growing our food. Unsustainable agricultural practices require the use of fertilizers and pesticides that can cause environmental problems, both on the land and in the consumer. Also, unsustainable agricultural practices can cause erosion and wear out the land on which the food is produced.
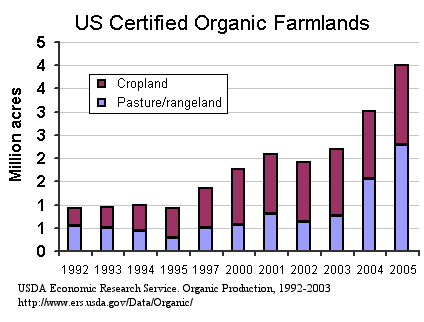
Fortunately, American consumers are becoming more aware of the importance of sustainable practices. The graph below shows the increase in acres being farmed using certified organic farming practices.6
 The next area of the Environmental Indicator discusses Waste:
- what happens to products after they have been used up
- the waste materials generated in their production
To see more information about consumers and products impact on environment, see our section on other Environmental Indicator efforts.
Footnotes:
- Adriaanse, Albert, et al. 1997. Resource Flows: The Material Basis of Industrial Economies. Washington, DC: World Resources Institute.
- WWF International, Zoological Society of London, Global Footprint Network. 2006. Living Planet Report 2006. Gland, Switzerland: WWF. Available at http://www.panda.org/news_facts/publications/living_planet_report/index.cfm.
- WWF International. Living Planet Report 2006.
- WWF International. Living Planet Report 2006.
- Halweil, Brian. 2002. Home Grown: The Case For Local Food In A Global Market. Worldwatch Paper #163. Washington, DC: Worldwatch Institute.
- US Department of Agriculture, Economic Research Service (USDA, ERS). 2005. Organic Production, 1992-2003. Data Product: Table 4-U.S. Certified Organic Farmland Acreage, Livestock Numbers, and Farm Operations, 1992-2003 . Available at http://www.ers.usda.gov/Data/Organic.
|

 Earth's Biological Capacity
The complement of the ecological footprint is the biological capacity of the earth to provide the things that support human life. A country's biological capacity depends upon factors such as climate, types of soil, and the annual rainfall. Canada and Brazil are very large in terms of land area and the population of both countries is smaller than the US population so their biological capacity per person is two to three times larger than the US. China has a very large amount of land but also has over 1 billion people so China's per person biocapacity is much smaller than the US. The graph below shows the biological capacity of different countries on a per person basis.3
 Since no individual in the United States lives completely off land that he or she owns, it isn't possible to estimate a personal biological capacity. Instead, biological capacity is calculated at a national level, based on the types and quality of the ecosystems contained within the countries borders. Since we live in a global economy, many of the resources used in a country often come from outside that country. That means a country's ecological footprint can be larger than its biological capacity.
Ecological 'Endowments'
A country's biological capacity is like a person's financial endowment or inheritance. Just as a person's financial endowment can be maintained or spent down over the person's lifetime, so, too, countries' ecological endowments can be maintained or used up. Calculations for ecological footprint and biological capacity show that most countries in the world are spending their natural capital at an alarming rate.4
The graph below shows the extent to which some countries are preserving or spending their biological capacity. Countries with a positive number, such as Brazil, Canada, and India, have economies that currently operate within their biological capacity. Countries with a negative number, such as the US, Japan and China, have economies that exceed their biological capacity. These countries are using up their ecological endowments - if they were companies, this would be called 'operating at a loss'.
 See our section on other Environmental Indicators efforts for more information about work that has been done to measure the ecological footprint at smaller scales such as regional and community.
Organic and Local Food
The food we consume is one component of our ecological footprint and material intensity. One measure of the extent to which food production uses environmental resources is food-miles: the average number of miles that food travels from where it is grown to where it is served. The farther food travels, the more fuel is used to transport it. The Worldwatch Institute estimates that in the United States in 2002, food traveled between 1,500 and 2,500 miles from the farm where it was produced to the place where it was eaten. This was an increase of 25% since 1980.5
Another issue is the extent to which sustainable agricultural practices are used in growing our food. Unsustainable agricultural practices require the use of fertilizers and pesticides that can cause environmental problems, both on the land and in the consumer. Also, unsustainable agricultural practices can cause erosion and wear out the land on which the food is produced.
Fortunately, American consumers are becoming more aware of the importance of sustainable practices. The graph below shows the increase in acres being farmed using certified organic farming practices.6
 The next area of the Environmental Indicator discusses Waste: