OVERVIEW
MANAGEMENT
PERFORMANCE
POSSIBILITIES
CAPITALS
ACTIVITIES
ACTORS
BURGESS
Metrics |
|
Burgess COMMENTARY |
|
Waste Generation Waste comes in many different forms, from many different sources, and is discharged in many different ways. The common end result is this: material that is no longer of use is discarded or otherwise ends up in the natural environment and affects the overall quality of life. Some of the effects are obvious and quite easily measured. For example, air and water quality are affected by emissions from cars and factories, runoff from land, wastewater from houses and businesses, and many other economic and social activities. Some of these emissions and their effect on quality of life are addressed in the Environmental Quality section of this indicator. Some sources of waste can be measured, but the effect on the environment is less easily quantified. Two significant areas of waste generation are municipal solid waste and hazardous waste from industrial sources. This section of the Calvert-Henderson Environment Indicator examines waste generation in the United States. Municipal Solid Waste In 2005, there were 245.7 million tons of municipal solid waste generated in the United States. This figure includes all manner of household waste, from food scraps to discarded packaging, furniture and appliances, to yard clippings. It does not include sludge from wastewater treatment or debris from constructing and demolishing buildings, roads, and other infrastructure.1 As the graph below shows, the amount of waste being generated in the United States has been steadily increasing since 1960, when the first reliable national numbers became available.
This increase is due, in part, to increasing population. From 1960 to 2005, the population in the United States increased 65%, from 180 million to 296 million. During that same time period, waste increased 179%! The amount of waste being generated by each person increased 70%, from 2.68 pounds per person per day to an average of 4.54 pounds per person per day, as the graph below shows.
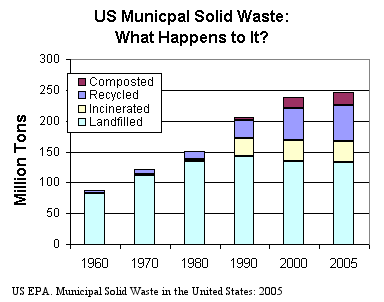
A Dubious Distinction... This makes the United States one of the most wasteful countries in the world-almost double the per capita waste generation of countries with similar quality of life, such as Canada and New Zealand. What Happens to Solid Waste? As the next graph shows, the majority of the waste generated is disposed of in landfills: 133 million tons in 2005, up from 88 million tons in 1960. On a brighter note, the percentage of waste being recycled or composted has increased, too. In 1960, only 6% of all the municipal waste was recycled. Now, 32% is recycled or composted.2
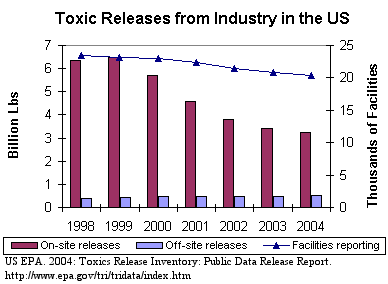
Industrial Hazardous Waste Companies use many different materials to create the products we use in the United States. Some of the materials are harmless, such as wood and water. But many hazardous materials are used or generated in the process of creating products. In the United States, information about the types and amounts of toxics that a company creates, uses, and releases into the environment has to be reported yearly to the US Environmental Protection Agency (EPA). This information is stored by the EPA in a database called the Toxics Release Inventory (TRI). TRI reporting began in 1986, but changes were made in 1998 that affected which companies must report and what chemicals must be reported. These changes make it difficult to compare the amounts reported before 1998 and after 1998. Since not all companies are required to report and not all toxic chemicals must be reported, the TRI is only a general indication of the amount and types of toxic materials potentially affecting environmental quality. As the graph below shows, the amount of toxics reported released decreased 45%, from 6.7 billion pounds to 3.7 billion pounds from 1998 to 2004.3
Most of the decrease is in materials that were being emitted into the environment at the company location, either into the air or being disposed of on land in some fashion, such as into on site landfills or into surface impoundments. For more information about waste generation in the US, visit the EPA web site or other sites listed in the section on other Environmental Indicator efforts. The next section discusses Environmental Quality - what the emissions of waste from economic and social activities do the environment that we live in. Footnotes:
|
|
|
| The text being discussed is available at http://www.calvert-henderson.com/enviro-waste.htm |


