OVERVIEW
MANAGEMENT
PERFORMANCE
POSSIBILITIES
CAPITALS
ACTIVITIES
ACTORS
BURGESS
Metrics |
|
Burgess COMMENTARY |
|
Health has been defined by the World Health Organization as 'a state of complete physical, mental and social well-being'. It thus transcends the absence of death, disease and disability, and incorporates concepts of well-being and quality of life; measures of health must likewise transcend mortality and morbidity. However, health does not exist in isolation, but rather it is the product of the interaction of our natural and built physical environments, socio-economic status, psycho-social conditions and cultural norms and beliefs with our physiological and psychological selves and our genetic inheritance. To reflect this complexity, the Calvert-Henderson Health Indicator focuses on three basic questions:
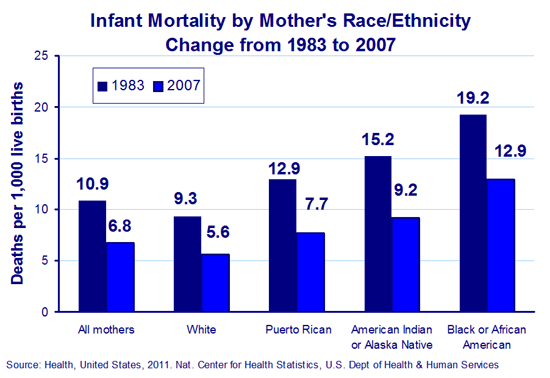
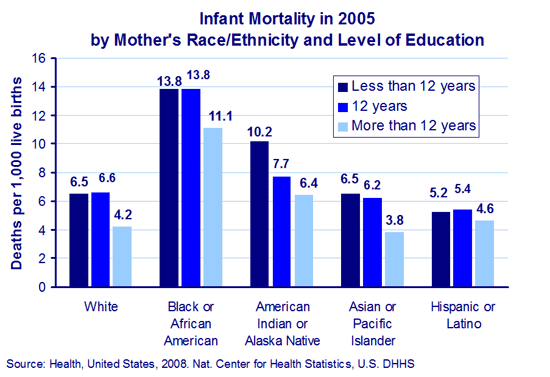
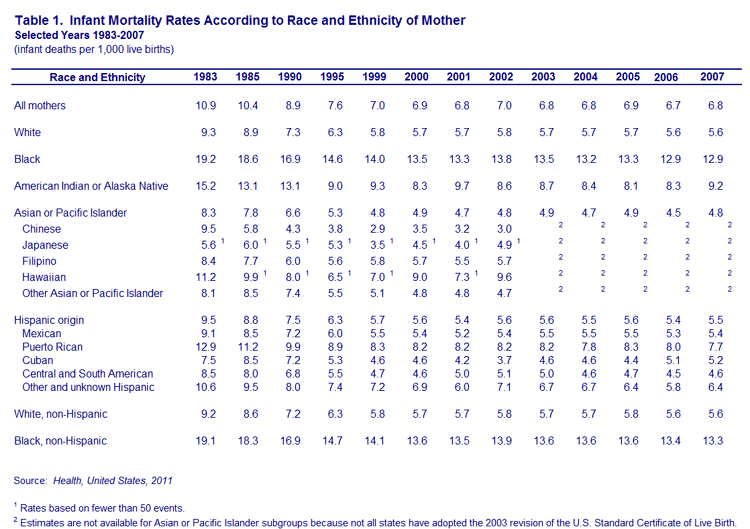
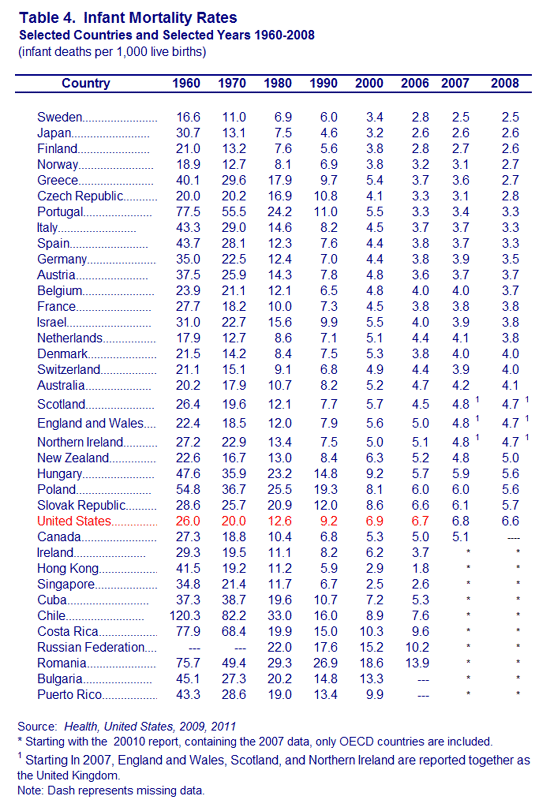
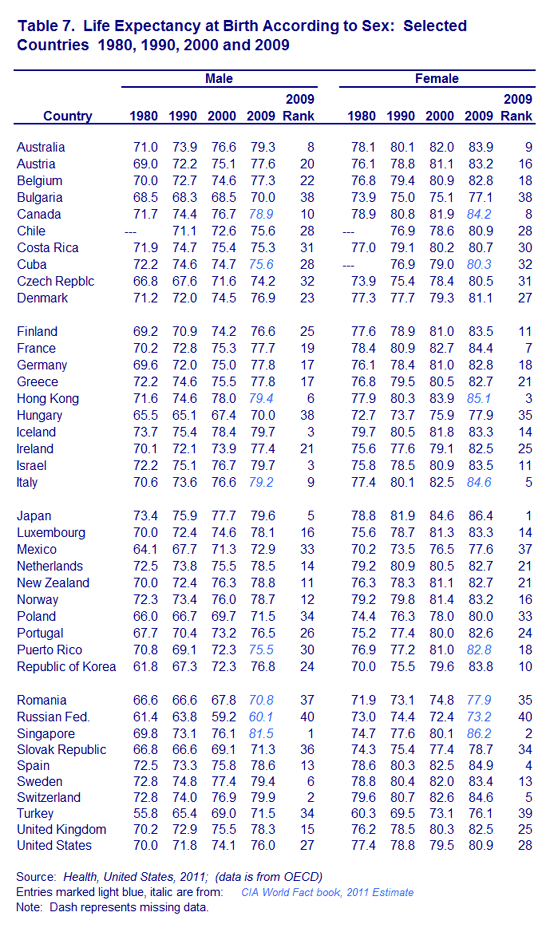
These issues are important because, while the United States provides more health care services at higher costs per capita than any other country in the world, we rank below most of the wealthy nations and even some of the poorer nations in basic health statistics like infant mortality and life expectancy. In addition, the benefits of health care are spread unevenly across the population in the United States with large disparities depending on race, income and education levels. The graphs below show infant mortality rates according to the mothers' race, ethnicity and education level. As the first graph shows, although there was progress in all the groups in reducing infant mortality rates between 1983 to 2007, the infant mortality rate for infants of Black or African American women in 2007 was more than double the rate among infants of white women and still well above the average of all women in 1983. The largest relative decline in Infant Mortality rates had been among the American Indian and Alaskan Native group, but in 2007 this group showed an increase in the mortality rate, so that the Hispanic and Asian/Pacific Islander groups now lead (2007 rates declined 42% relative to their 1983 rates, see Table 1 for details) while the smallest decline was among infants of Black non-Hispanic mothers (30% decline from 1983 rates). Thus, the comparative disadvantage of infant mortality for Black groups has actually worsened, from a ratio of 1.76 times the average rate in 1983 to nearly double the average rate in 2007 - inequality has actually worsened!
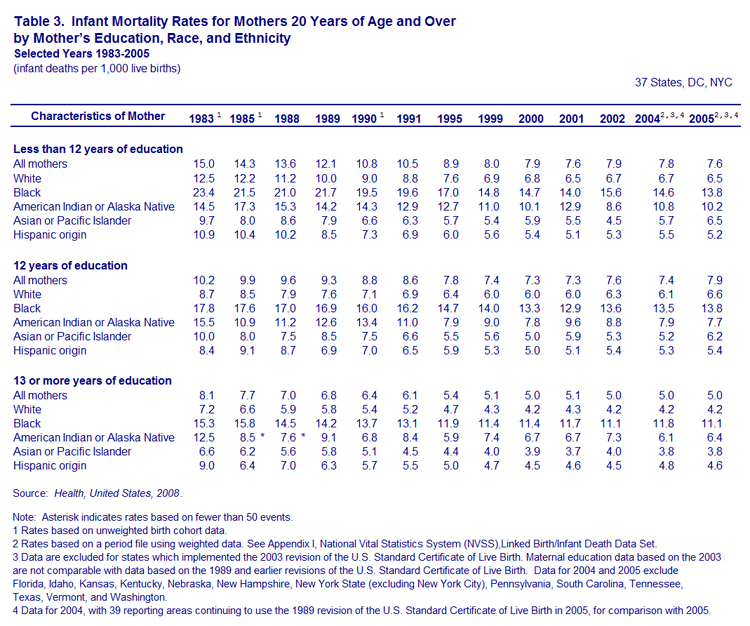
Mortality rates for infants go down as the level of education of the mother rises although even here there is a wide disparity between races as seen in this next graph.
The focus of national health efforts needs to be both on the improvement of overall health and well-being and the reduction - indeed the elimination - of disparities in health; disparities that are rooted both in the broader determinants of health and the differential access that people have to those determinants, and in biological differences. For this reason, the Calvert-Henderson Health Indicator also includes a measure of the quality of life people experience (such as self-reported health) as well as more conventional measures of mortality and or morbidity and allows an analysis and understanding of socio-economic, geographic, gender-based, ethno-cultural and other disparities, and the access - or lack of access - that people have to the fundamental determinants of health.
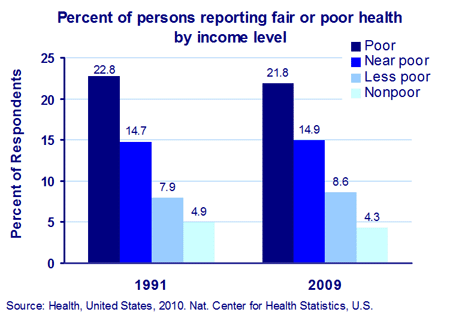
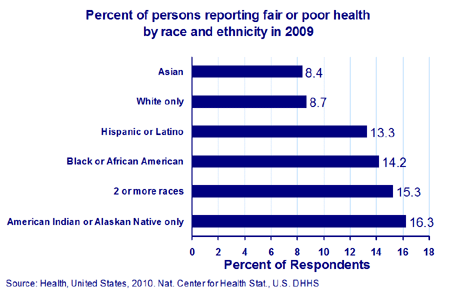
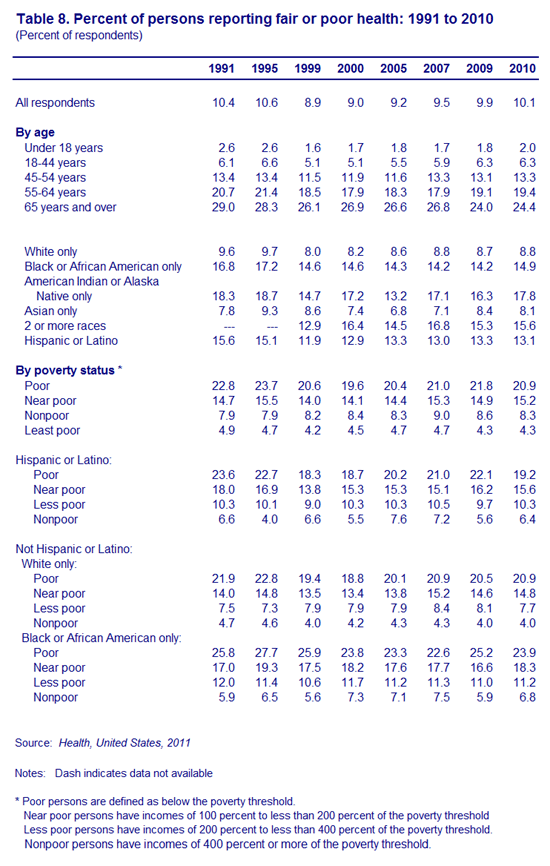
As the graph above shows, people living below the poverty line are more than three times as likely to report their health as fair or poor compared to people with incomes at least double the poverty line. The range in the survey is a five point scale including excellent, very good, good, fair and poor, so fair and poor are below the midpoint of the scale. Poor was defined as below the poverty line, near poor had incomes between 100 and 200 percent of the poverty line less poor had incomes between 200 and 400 percent fo the poverty line, and nonpoor had incomes more than four times the poverty line. In addition, there is a disparity in self-reported health in terms of race or ethnicity, as shown in the graph below.
The indicator offers a model of the current U.S. healthcare system to help clarify a systemic set of issues. Health is being redefined beyond the medical intervention model. Today, Americans are focusing on prevention, stress-reduction, and lifestyle choices. Tobacco and alcohol use, and even the availability of guns, are issues entering the public health debate. More Americans now consult 'complementary' and 'alternative' health providers than visit conventional medical doctors and facilities. This is a paradigm shift, which is restructuring the entire medical-industrial complex and its technocratic, bureaucratic approach that represents some 14 percent of GDP. New statistics are needed as the U.S. integrates these two very different approaches to health. The Calvert-Henderson Health Indicator is a first step towards an expanded concept of health to include acute intervention, remediation, disease prevention (and root cause diagnosis), education, and ultimately, behavior patterns to promote long-term health. Health Expert: Dr. Trevor Hancock Table 1. Infant Mortality Rates According to Race and Ethnicity of Mother
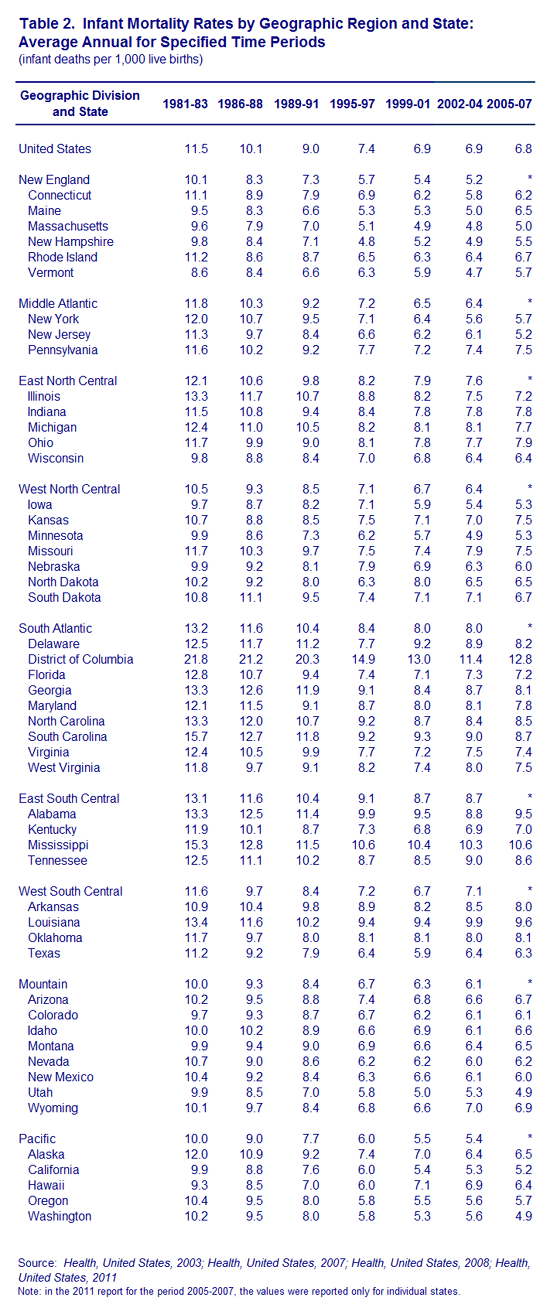
Table 2. Infant Mortality Rates by Geographic Region and State
Table 3. Infant Mortality Rates by Mother's Education, Race, and Ethnicity
Table 4. Infant Mortality Rates, Selected Countries and Years
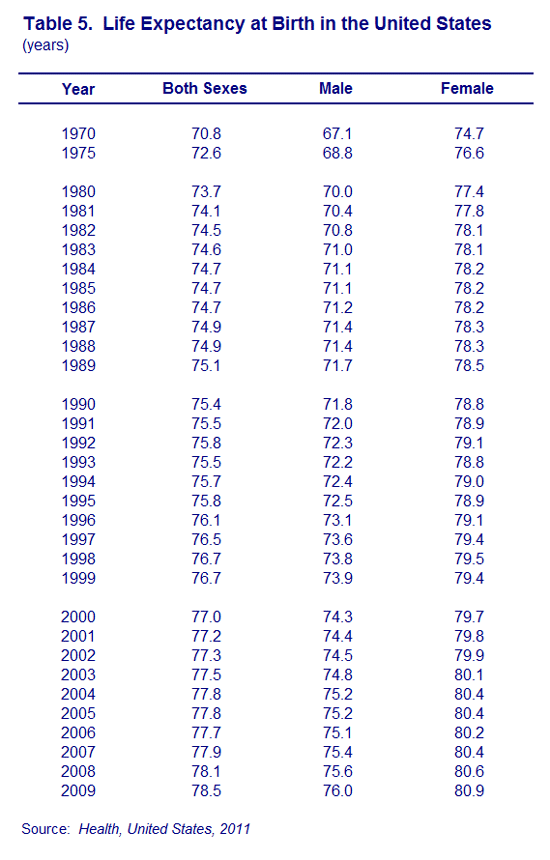
Table 5. Life Expectancy at Birth in the United States
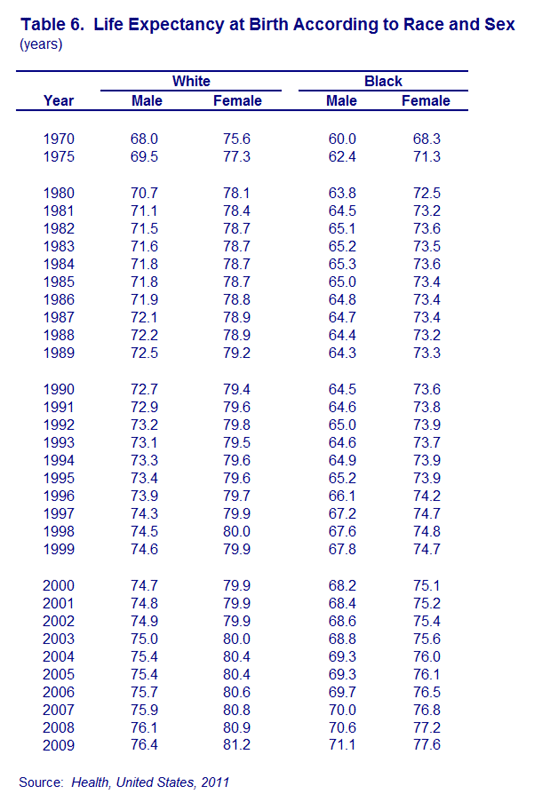
Table 6. Life Expectancy at Birth According to Race and Sex
Table 7. Life Expectancy at Birth According to Sex: Selected Countries
Table 8. Percent of People Reporting Fair or Poor Health
|
|
|
| The text being discussed is available at http://www.calvert-henderson.com/health.htm |
