OVERVIEW
MANAGEMENT
PERFORMANCE
POSSIBILITIES
CAPITALS
ACTIVITIES
ACTORS
BURGESS
Metrics |
|
Burgess COMMENTARY |
|
The Calvert-Henderson Infrastructure Indicator unpacks macro-statistics to reveal an ongoing debate: To what extent has the U.S. been overlooking the vital role infrastructure plays in undergirding its economy?
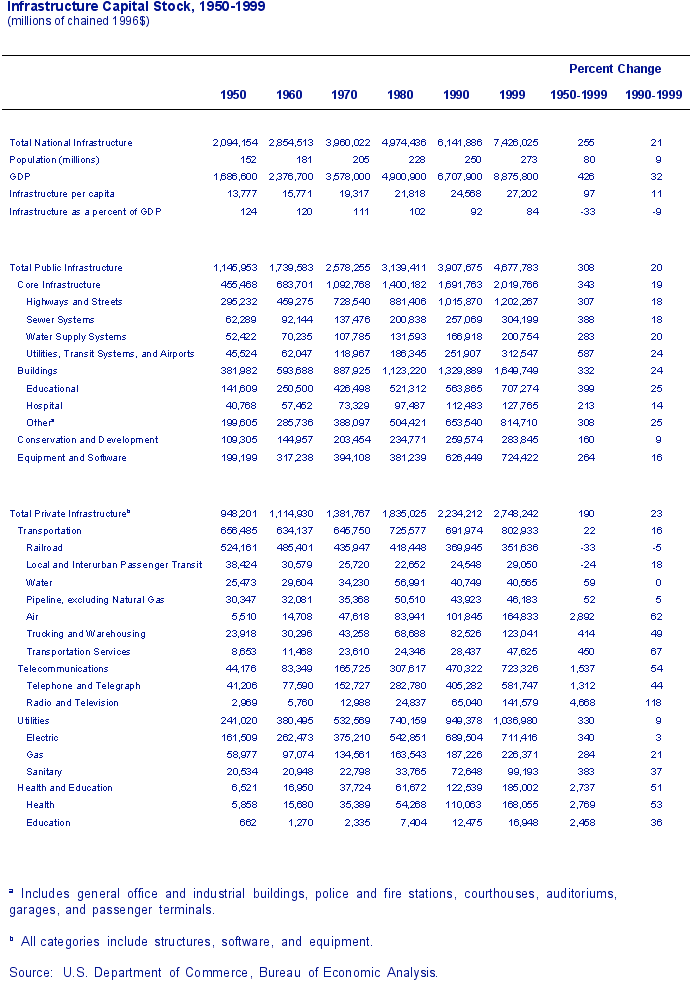
In 2009 this debate is settled. The USA has under-invested in its vital infrastructure for decades, as evidenced by the bridge collapse in Minneapolis and breached levees that flooded New Orleans, to floods along the Mississippi River and in the Washington D.C. commuter trains' collision and massive water main break. At last, the Obama stimulus plan is addressing a backlog of over $1 trillion, with $13 billion for high speed and commuter rail and over $50 billion for renewable energy and the new smart electric grid. Historically, infrastructure referred to highways, railroads, harbors, bridges, aqueducts, public buildings, dams, and the like. Industrial societies evolved airports, communications systems, energy supplies, water, and other utilities. Today, infrastructure includes education, research & development, computerized systems, and all taxpayer-supported systems used in commerce. Between 1947 and 1999, the public and private infrastructure capital stock of the U.S. more than tripled in real terms to stand at $7.4 trillion, two-thirds of which is public infrastructure. The indicator picks up the recent trend to privatize growing areas of formerly publicly-owned infrastructure, including electric utilities, phone, water, and other services. After the 2001 electricity blackouts in California, a re-evaluation of deregulation of such vital infrastructure is underway. Such publicly funded investments used to be 'expensed' items in GDP accounts. As of 1996, a more realistic asset budget in GDP now accounts for such investments as 'assets' since they often have a useful lifetime of 50 to 100 years or more. This accounting change has contributed to the U.S. budget surplus. Infrastructure Expert: William J. Mallett, Ph.D. updated by Hazel Henderson. Update on Infrastructure in the United States Table 1. Infrastructure Capital Stock, 1950-1999
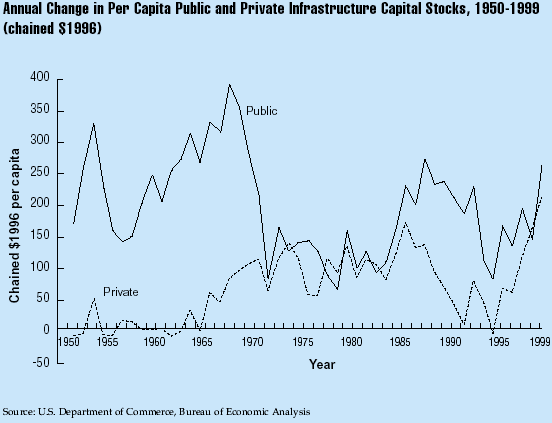
Figure 1. Annual Change in Per Capita Public and Private Infrastructure Capital Stocks
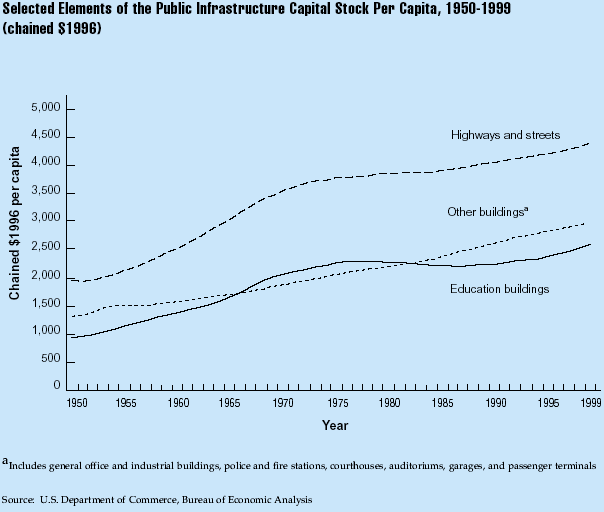
Figure 2. Selected Elements of the Public Infrastructure Capital Stock Per Capita
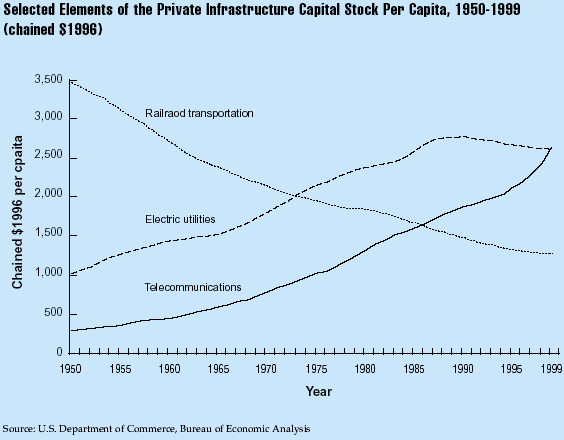
Figure 3. Selected Elements of the Private Infrastructure Capital Stock Per Capita
Infrastructure Indicator by William J. Mallett, Ph.D. (Updated May 24, 2001) Between 1947 and 1999, the public and private infrastructure capital stock of the United States more than tripled in real terms to stand at $7.4 trillion (in chained $1996 dollars). Calculating infrastructure in relation to the size of the population shows that the capital stock was worth about $26,600 per person in 1999, up from $13,800 per person in 1950. At the end of the 20th century, public infrastructure, including such things as roads, water and sewer facilities, and conservation and development structures, is a little less than two-thirds of the total infrastructure stock. That is higher than its share immediately after the second world war, but down from its peak in the late 1960s. Private infrastructure, including railroads, telecommunications, electric and gas utilities, and education and health services, makes up about one-third of the total stock. The public infrastructure capital stock expanded greatly in the 1950s and 1960s, followed by much slower growth in the 1970s. Public infrastructure per capita, picked up again in the late 1990s, following a phase of moderate growth from the mid-1980s through the early-1990s. Private infrastructure growth per capita was negligible during the 1950s and 1960s boom on the public side, but picked up in the 1970s and 1980s. After dipping again in the early to mid-1990s, private side growth took off in the late-1990s. Public Infrastructure The pattern of growth in the public infrastructure is largely a function of investment in streets, highways and education, which grew at a fast rate through the 1950s and 1960s with the building of the Interstate system and the baby boomers passing through the education system. Growth in the public street and highway infrastructure per capita began again in the mid to late 1980s, after reaching a plateau in the 1970s. Education infrastructure declined in the late 1970s through the mid-1980s with the baby bust generation, but picked up again the late 1980s. There has been steady growth in the per capital worth of other government buildings which includes general office and industrial buildings, police and fire stations, courthouses, auditoriums, garages, and passenger terminals. Private Infrastructure Several elements of the private infrastructure stock - air transportation, telecommunications, and education and health services - have grown rapidly in the post World War II period. Since 1990, air transportation, trucking and warehousing, and other transportation services infrastructure have grown markedly. Telecommunications infrastructure also boomed in the 1990s with growth in the Internet and the cellular telephone industry. In per capita terms, the private electric utility infrastructure has declined from its peak in the late 1980s, a problem that coupled with increasing demand is beginning to affect power supply, most especially in California in 2001. Another potential area of trouble is in railroad infrastructure, which has declined steadily despite rising demand. |
|
|
| The text being discussed is available at http://www.calvert-henderson.com/infra.htm |


