|
|
|
PROGRESS is the increase in VALUE (of the STATE) from beginning to end of the period
|

|

|

|
|
PERFORMANCE is very complicated, and depends on the PERSPECTIVE of the analysis
|
Conventional Metrics
In the corporate world and the investment community, progress is increase in stock value of the company. The dominant measure of success is an increase in the valuation of the company and everything revolves around this measure.
Corporate business accounting has well defined ways of computing profit for business. This definition of profit by Lord Benson over 60 years ago is very simple!
In the 1950s, Henry Benson … a senior managing partner at Cooper Brothers in the UK was asked while testifying in a British High Court to define profit. After a short moment of reflection he replied:
“My Lord, a profit is the difference between two balance sheets”
Henry Benson subsequently became Sir Henry Benson and later on Lord Benson. Cooper Brothers combined with Lybrand, Ross Bros and Montgomery of the United States to form the international firm of Coopers and Lybrand which in turn became a part of PriceWaterhouseCoopers (PwC)
This definition is one of the most elegant definitions about anything anywhere. It is such a contrast to the way profit gets defined in law and regulation … such as the FASB standards and IASB standards, where different rules can be applied in a variety of different circumstances, and in the end, there is no certainty about anything.
|
|
|
PROGRESS is CHANGE in STATE
|
GO TOP
|

|

|

|
PROGRESS is CHANGE in STATE
Progress is when the Post Activity status is better than the status Pre Activity.
|
WHY THIS IS POWERFUL
The idea that progress may be measured simply by assessing the change in the STATE from the beginning to the end of a period means that there is a huge reduction in the data that are needed. Instead of having to have all the transaction data for the period, it is possible simply to have data about the beginning of period state and the end of period state.
This is a foundational aspect of conventional double entry accountancy and one of the main reasons why it is so powerful and has stood the test of time.
TPB Note: Over the years I carried out hundreds of project evaluation and supervision assignments for the World Bank, the United Nations and others. I always tried to understand the situation pre-project and the situation post-project in order to determine if the project had had any meaningful impact. Sadly many of the projects had not improved the situation in any significant way, though a more conventional way of assessing the project would have concluded that they had been successful. The conventional approach to project monitoring was to compare activities as planned with activities as implemented, and compare the planned cost of these activities with the actual cost of the activities. If all of this was OK, then the project was deemed a success ... whether of not there had actually been any improvement in the STATE of the situation being addressed. Sadly this did not make me popular, and eventually my work as a project evaluation consultant dried up ... not a surprise, but another lesson learned
|
|
|
ACTIVITIES HAVE IMPACT THAT CHANGES STATE
|
GO TOP
|
In this image, the value is the same at the end of a period as it was at the beginning ... ordinary daily activities produce what is consumed ... it is a stable steady state situation.
|
|
|
|
The steady state situation is unusual. What is normal is either progress or regression. In this next case the value at the end of a period is more than at the beginning of the period ... ordinary daily activities produce more than is consumed, and the result is an accumulation of value.
|
|
|
|
In this last case the value is the less at the end of a period than at the beginning of the period ... a problem because activities produce less than are consumed.
|
|
|
Progress is the amount by which the VALUE at the end of the period (EOP) is more than the value at the beginning of the period (BOP)
An important thing to note is that progress can be measured in every situation without needing to know anything about the activities during the period.
|
|
|
TRUE PROGRESS IS ABOUT ALL THE CAPITALS
|
GO TOP
|
Instead of simply thinking about STATE and CHANGE IN STATE as the totality of a single capital, it is more meaningful to segment the STATE into separate capitals which in total reflect ALL the capital.
|

|
Since this image was created, there have been several changes in the way the capitals are named. The core concept has not changed. The naming has been changed better to reflect the way the socio-enviro-economic system works and the way it needs to be measured and managed.
The basic concept is that the PROCESS or ACTIVITIES during the period change the STATE which exists at the Beginning of the Period (BOP) to become a new STATE at the End of the Period (EOP)
In the above graphic (prepared around 2009) ALL the CAPITAL was segmented thus :
(1) Financial Capital ... Created Financial Capital
(2) Human Capital ... Human Capital and Social Capital
(3) Man Built Capital ... Created Physical Capital and Created Intangible Capital
(4) Natural Capital
(5) Sun ... the main source of energy for planet earth
TVM's preferred segmentation of capital has evolved to these three major segments:
(1) Social Capital;
(2) Natural Capital; and
(3) Economic Capital.
Specific changes are as follows:
(1) Financial Capital to be part of Economic Capital (EC)
(2) Human Capital to be now referred to as Social Capital
... ... includes Human Capital, Relationship Capital and Locational Capital
(3) Man Built Capital to be referred to as Economic Capital (EC)
... ... includes Financial Capital, Physical Capital and Intangible Capital
(4) Natural Capital which
TVM also makes reference to this:
(5) Sun ... the foundational source of energy for planet earth
Aggregating ALL the CAPITALS into a single category hides the very different behaviors of the separate capitals. The use of just 3 segements reflects the need to keep things simple, but at the same time reflect changes in an efficient meaningful way.
Each of the major segments has many sub-segments. There are around 20 for each of the main segments.
|
|
Consider these trends in STATE over time
|
|
More and more DEPLETION and DEGRADATION of NATURAL CAPITAL is UNSUSTAINABLE
|
|
What has been happening and what needs to happen
|
|
THE WHOLE SYSTEM
|
THE ACTUAL PAST
|
A NO CHANGE FUTURE
|
A BETTER FUTURE
|

|

|

|

|
|
More and more DEPLETION and DEGRADATION of NATURAL CAPITAL is UNSUSTAINABLE
|
Up to now SOCIAL CAPITAL and ECONOMIC CAPITAL have increased but NATURAL CAPITAL has been dangerously degraded.
Unfortunately, in addition, the benefit of SOCIAL CAPITAL growth has been compromised by increasing inequality.
Continuing in this way is an unacceptable existential risk. There is a broad consensus that massive changes are essential. A better way is possible. This requires a system that enables prosperity without growth and every process improved so that production does less environmental damage
|
|
|
PERFORMANCE
Resources Used / Value Created
|
GO TOP
|
|
.
|
There are many different ways to represent how ACTIVITIES have impact on STATE. The graphic reflects the STATE of a place at the beginning of the period (BOP) and at the end of the period (BOP) together with external resources that were mobilized to enable the development of the place.

IMPLEMENTATION ACTIVITIES consume RESOURCES. In conventional financial analysis this becomes the COST. When this is related to the amount of the activity ... how much is done ... this gives a unit cost of the activity.
IMPLEMENTATION ACTIVITIES also create IMPACT and VALUE. The VALUEADD improves STATE. The amount of valueadd relative to cost is a measure of effectiveness.
My experience carrying out project monitoring and evaluation for major development organizations over a period of years was disappointing insofar as the M&E methodology typically used was to look at activities quite rigorously but not so much the impact. In the majority of situations the resources were used for project activities as required by the project authorization, but rarely did these activities deliver impact in a effective way. For most of the time when I was actively doing this work, the World Bank, for example, used its disbursement activity as a proxy for project performance. and were annoyed when my style of M&E analysis suggested that the resources disbursed had not translated into valueadd at the project level. My analysis work usually highlighted many important constraints that made project performance as measured by impact quite unsatisfactory. My work also identified time and time again that most projects were designed in ways that made esential adjustments very difficult to make. Over time this became more and more of a problem because of bureacratic attempts to control issues like bribery and corruption.
|
Efficiency
TVM uses the basics of business cost accounting to get metrics about performance efficiency. The simple questions are (1) how much did it cost? and, (2) how much was done?
With the answers about cost and how much done, it is possible to calculate the “unit cost” of the work done. Performance is not just an absolute metrics … it is also about how much is achieved compared to what could have been achieved.
So there is a third question (3) how much should have been done with this amount of cost? This is often done in the corporate environment using “standard costs” which are the expected cost for any specific activity.
Efficiency is a function of the difference between the actual costs and the standard costs.
Alternatively, efficiency is the difference between what was done relative to what should have been done.
Cost accounting measures performance efficiency. In TVM this is complemented with value accounting so that all the elements of socio-economic value flows are taken into consideration.
Cost efficiency is the simple idea of comparing the actual cost with what the cost should have been. This is a powerful way of getting control of operational performance. How much should it have cost to do what was done?
Knowing how much got done is pretty basic. Without knowing how much got done, there can be no oversight, control or accountability ... no inventory control ... no operational analysis ... in other words, without knowing how much got done, the whole process of management falls apart. With cost analysis it is possible to move on to evaluate whether or not the operations are efficient. One way of doing this is to compare what is being achieved with what should be achieved.
What it should have cost is a technical question. The cost that it should be can be calculated based on what needs to be done and the prevailing processes and costs. The cost in one place can be compared to costs in other places. The cost now can be compared to costs in a prior situation.
Cost efficiency is the simple idea that something should have cost X but in fact cost Y. The cost X is the cost that would be expected with a reasonably high level of performance efficiency ... usually calculated by reference to technical specifications, knowledge of the work to be done, and so on. The actual cost Y is what the accounting shows the item actually cost.
A standard cost is simply what something should cost based on technical considerations and the prevailing normal prices. A well done calculation of standard cost includes norms for efficiency and what would be usual in the usual setting. In the international context different standards may be used for different countries, and used for comparative analysis.
The international relief and development community has been doing “relief and development” for upwards of 60 years. A corporate cost accounting mindset would have set the stage for this community to know quite clearly what things should cost ... but rather than being an “open book” with a full set of accessible standard costs, the cost of everything is treated rather like a “state secret” that will put the nation in danger. Underneath this secrecy ... costs are probably too high and performance too low ... and no transparency a must
When there is a variance and costs are significantly higher than they “ought to be” there is almost always a reason. Frequently the reason is that the buyer and the seller ... people usually, but sometimes the institutions ... have some agreement that is not in the best interest of the groups that should be benefiting from the transaction. This is a common problem.
A public TVM database of standard costs will help to identify situations where costs are out of control or have been distorted by inappropriate transactions. A very simple database of costs will enable comparisons to be made ... and judgments made about where costs are out of line. Too low a cost may be an indicator of a problem just as much as too high a cost. Sometimes low cost is achieved by low quality ... and this might well have serious secondary effects.
Low cost (price) drugs may be because a supplier is forgoing high profits ... which is good ... or it might be because the drugs being supplied are sub-standard and maybe dangerous ... which is bad.
|
|
|
STATE ... A Balance Sheet Shows State
Progress is Balance Sheet improvement over time
|
GO TOP
|
Progress … incremental value over time
Progress is incremental value … that is improved quality of life … improved social value that makes quality of life better.
Socio-economic value progress is one of the core metrics for a smart society … yet almost absent from the money related metrics used by the corporate community, capital markets and the broader society at the present time.
TVM has a community focus treating the community as the reporting entity. The rules for consolidating accounts apply as all the subsidiary units doing economic activities in the community are brought into account. TVM includes transactions that reflect value as well as the normal money transactions.
TVM is more accountancy than a statistical construct. The data are as simple as possible ... the transactions as small as possible, as many as possible and as clear as possible. Some of the value of TVM derives from how TVM can do accounting for community progress. In the following graphic ... the value of the community at the beginning of the period is the same as it is at the end of the period ... the community has gone about its business for the period, the time has gone by, but nothing has changed.
Data about the daily activities is not needed in the TVM system in order to be very clear about progress ... whether it is progress or problem. All that is needed is data about the value changes that have taken place from the beginning of the period to the end of the period as shown below.
Progress is about an improving quality of life … it is not merely having more profit or more growth, though these may be part of the assessment. In the TVM methodology the primary measure of progress is the value increment accruing to a society … the net of value consumed in the period and the value created during the period taking into consideration all the activities of the community. The framework for quantifying value transactions have some similarities with those of business accounting.
The three key datapoints in TVM are cost, price and value. Value is the key datapoint in measuring progress or problem. Cost is a function of and derivative of productivity and important in the analysis of activities. Price is important in money accounting and how value creation is allocated to different groups.
Units of Account for Value
Value is important, but it is also a complex datapoint because there are many different views for any specific element of value. This has been embraced for some years now by capital markets as they have created more and more complex financial instruments ... maybe not all of them proving to have substance ... but the basic idea also works for TVM value. In the case of TVM there are a combination of standards drawn from various disciplines including conventional financial accounting. TVM refers to the unit of account as SVUs ... Standard Value Units.
More than anything else TVM is designed to be very practical, very simple, very low cost and very effective.
|
|
|
Growth of Wealth is NOT a Good Measure
|
GO TOP
|
Wealth Growth NOT a Good Measure
The driving force of modern market economics and capitalism has been the simple idea that the pursuit of wealth is the best incentive for people to be fully engaged in activities that produce progress. There is no question that an economy based on this premise is better than one driven by egalitarian sharing of the product of enterprise … as in socialism or communism … but that does not mean that the capitalist market system works very well and is the best that can be devised.
This idea has been articulated in many different ways, including in the writings of people like Adam Smith and John Stuart Mill, but the world has changed a lot since their ideas were formulated.
Without an effective alternative system for the measurement of performance, using money metrics, wealth and profit performance will show the capitalist market system to be “the best there is” … but, based on true value metrics (TVM) it becomes abundantly clear that something very much better is possible.
Simply put ... better metrics requires that impact on ALL the CAPITALS is taken into consideration in the analysis of every ACTOR in the complex socio-enviro-economic system.
Building wealth by the exploitation of the poor is as old as history. While there is nothing wrong with the creation of wealth … there is a lot wrong when there is little progress out of poverty because it is the price being paid for the accumulation of wealth and its concentration in the corporate sector and among powerful individuals in the economic elite. Concentration of economic power was seen as detrimental to society in the era of the “robber barons” in the late 1800s, and the basic logic of that argument has not changed at all over the years and still applies in the 21st Century
|
|
.
|
Effectiveness
Effectiveness is not the same as efficiency. They are two very different measures that are critical to management and oversight of performance. A society will progress best when the socio-economic activities are both efficient and effective.
Performance is not just an absolute metrics … it is also about how much is achieved compared to what could have been achieved.
What progress for the money? In money accounting terms cost effectiveness is progress relative to the money used.
What value adding for value consumed? In value accounting terms effectiveness is progress or value adding relative to the resources consumed.
Money metrics a proxy for value metrics … in many cases the money metrics are a reasonably good proxy for the value metrics … but not always.
Need to measure impact, not activity. A football game … American football, that is … is won when points are scored, not merely by having the players “in motion”. The amount of “activity” is merely motion, unless the motion results in some sort of impact.
A society progresses when its socio-economic activities are efficient and effective. TVM therefore incorporates cost accounting that measures performance efficiency and value accounting that is the basis of socio-economic productivity. Performance is not just an absolute metrics … it is also about how much is achieved compared to what could have been achieved.
Productivity measures in the main are broad indexes of relationships between for example the revenues of an industry with the payroll of the industry. This measure suggests that productivity is increased when there is more output for less input. But this measure ignores all the value impact associated with, for example, less payroll and therefore higher unemployment and its associated value destruction.
Money and material resources at the community level only benefit the beneficial owners of these resources unless other things are going on as well. The metrics of the community performance must identify not so much the ownership of money and material wealth, but whether or not the community is constrained because these things are not being used for any benefit in the community.
Take the case of a bank in a community that has control over money and material resources in a community.
Banks operate in and have branches located in most communities … not all communities … but many. A bank is a custodian for money wealth, and produces money profit for the owners of the bank and its senior executives and decision makers using this wealth. All of the bank's money transactions are recorded and periodically consolidated and reported on. There is no reporting of what the bank does for the community where is is located … whether the bank serves to diminish the performance of the community and quality of life or not … the only metrics are about the bank's profits!
|
|
|
Activities change the Balance Sheet
There is IMPACT on ALL the CAPITALS
|
GO TOP
|
ALL activities have impacts on ALL the capitals
Since the emergence of modern capitalism the primary goal of entrepreneurship and investment activity has been to increase financial wealth using 'Land, Labor and (financial) Capital', that is the classical 'Factors of Production'. The main metrics for this system have been business profits computed using conventional double entry financial accounting and wealth measures correlated with stock market prices, and perhaps to a lesser extent prices in other markets like the commodity markets, housing markets, etc.
Resources are consumed
TVM considers activity as an event that consumes resources and creates outputs like goods, services and happiness. Where value creation exceeds value consumption there is value adding, otherwise value destruction.
TVM treats the period value adding aspect of economic activity in the balance sheet in exactly the same way that period profit is treated in a business balance sheet. The profit of business is the net of changes in all the assets and liabilities of the business balance sheet. Similarly the value adding of economic activities changes the value balance sheet.
The balance sheet concept applies at the level of the activity or of the community. The value balance sheet may be used also for organizations and for individuals or families. The most useful for the “management” and oversight of society and socio-economic performance is, however, the balance sheet of the community.
Value is created
When a resource is consumed in some activity, something is done. It is of interest to know what is done, but normally the objective is not to do something but to have something of value be created. Metrics about the amount of activity in relation to the resources used enables the calculation of cost efficiency … but it is the production of value that is more important and enables the calculation of cost effectiveness.
Where value creation exceeds the value consumption there is value adding … otherwise there is value destruction.
Value adding or destruction impacts balance sheet
Value adding or destruction impacts the balance sheet … the balance sheet of the activity and the balance sheet of the community.
A community balance sheet that incorporates elements of quality of life will change when value adding or value destruction activities take place in the community.
It should be noted that “off balance sheet” transactions are as wrong in TVM value accounting as they are in corporate accounting. The value balance sheet for a community is affected by all socio-economic activities that relate to the community.
Profit only one part of versus Value Change
A value balance sheet for a community that is host to large scale minerals extraction will quantify what it is losing in natural resource value compared to what the community is gaining in value such as employment and perhaps assistance with infrastructure, education, health, etc. TVM value chain analysis and value accounting relative to the business organization may indicate that the profit for the organization is substantial while there is offsetting value destruction for the community.
How can this be? And the answer is that business money profit accounting keeps value “off the balance sheet”! It can be argued that not having value metrics is important to the modern corporate community!
|
|
|
Wrong GOALS / Wrong METRICS
To change the game, change the way the scoring is done
|
GO TOP
|
Winning the Game! But what Game? ... More and more … of what?
So much of modern progress has merely been doing more and more of what, arguable, the world neither wants or needs. A huge effort has been expended in trying to create wants and needs … for not good reason.
Maximizing corporate profits and financial wealth
The measures (metrics) for corporate profits and many related metrics about economic performance like GDP growth are computed all the time and reported frequently. Compared to this reporting there is nothing like it for the progress and performance of SOCIETY or the ENVIRONMENT. It is not surprising that there is an almost total focus on maximizing profit perfornabce and financial wealth creation and virtually nothing to ensure social progress and the minimum of environmental damage.
The world has achieved an amazing capacity to produce … something never achieved before at any time in human history, but the metrics about socio-economics are pushing for production of all the wrong things … essentially for things that produce the most profit. Prevailing metrics give no encouragement for those initiatives that would help satisfy important needs and be very valuable without being profitable. As long as the present dysfunctional metrics continue, ACTORS will make decisions that are terribly dangerous for the future of humankind and the planet.
Maximizing quality of life for ALL people
In the money metrics construct winning is more and more of money and material goods … with quality of life assumed to improve with more and more of these things.
Doing the least damage to the environment
Much of the fabulous human progress made in the past 200 years has come at the expense of the environment. The measures have been powerful for everything to do with financial capital and wealth, but the related value destruction of NATURAL CAPITAL has been totally ignored until quite recently. There is now an increasing amount of talk about sustainability, but so far no widely accepted system for numbering social and environmental performance.
Keeping Score
In sports, scorekeepers keep score and the score tells which team it is that wins. Society is similar … with the present money metrics system of scoring, winning is about more and more money. In a value based society winning will be maximizing quality of life … the values that make life worth living.
TVM thinks of progress as winning the game … and maximizing quality of life. This is not a money construct but a value construct and way more complete as a system of metrics than mere money and money accounting that has changed rather little since it was devised in its modern form some 400 years ago. In TVM, progress … maximizing the quality of life … has a central role, just as profit has a central role in the business entity and the money metrics of capital markets.
|
|
|
Impacts of Activities on Intangible Capitals
Intangible Capitals comprise Relational, Knowledge, Institutional, Cultural and Locational Capitals
|
GO TOP
|
Many activities have impact on intangible values
There are many intangible activities that can change the value balance sheet of an entity … and change can be significant and happen rapidly.
Policy improvement
For example, improvement in the policy framework that expands economic opportunity changes the “value” of many of the community value assets associated with people. TVM enables the dynamic of exponential change to be recorded and be a part of the accountability of decision making.
Improvement in the way decisions are made about allocation of resources to value adding activities changes the value balance sheet. TVM makes explicit the relationship between tangible and intangible activities and value change even though these matters are not linear but multiple sets of complex exponential multipliers.
Security … crime
Security changes intangible values a lot … the value of security is high based on all the economic opportunity that exists when there is security compared to when there is not. People need security in order to go about their daily lives and engage in socio-economic activities. A high crime neighborhood is associated with a poor quality of life! Remove the crime and the quality of life for everyone in the community improves.
Job opportunities
The “value” of a person is diminished when there are no job opportunities where a person may used their skills. Quality of life goes up when people have opportunities to use the skills that have been God given or acquired by hard work and diligence.
Organization
A place may have people and resources but nothing gets done and there is no progress when the right organizations do not exist. Without a capacity for organization very little gets done. Putting in place an framework of organization adds value to the community and enables resources to be used effectively to create the value for progress.
|
Paradigm change ... Not only a bigger pie … a better pie!
TVM is aiming for some paradigm change. In the TVM view, global economic performance is the aggregation of socio-economic performance in the individual communities. Progress and performance is a result of tangible activities at the community level … done by real people who understand the cause and effect of actions in their locality.
The history of economic performance has a lot to do with technology and productivity … and much less with issues like monetary and fiscal policy. Technology and productivity are the “changemakers” that enable the creation of wealth, while monetary and fiscal policy, and the framework of law merely reposition wealth among various constituencies in society.
The prevailing metrics suggest that the global economy has done very well when viewed from the luxury of society at the top of the socio-economic pyramid … but the performance of the global economy from the perspective of more than 4 billion people who are poor and hungry, the socio-economic performance is pathetic.
There are chronic problems with the socio-economic system and especially decision making and the allocation of resources and the accountability for resource use … and the prevailing system of metrics does little or nothing to help.
The singular incentive of money, power and profit has created a monster that is difficult to tame … but not impossible. Metrics are very powerful … but the metrics need to be about all the important things and not only about the money profit subset of metrics. There also need to be metrics about important social value matters, even though these are more difficult to quantify.
The way the modern socio-economic systems works is not merely inefficient, it is substantively dysfunctional. It does not have the capability to allocate resources to satisfy the real needs of billions of people, but puts resources into “creating” artificial need for people who already have more than enough for their well-being.
How do Heads of State become billionaires?
There is something very wrong with a socio-economic system where Heads of State in countries that are resource rich become money billionaires while the population of their countries remain in a chronic condition of poverty. This reflects decision making metrics that are money profit weighted with little or no attention to social values … or indeed basic moral values!
Early in my life I had difficulty understanding how the Sultan of Brunei could be the world's richest person in one of world's poorest countries. Many of years later it became clear. He had earned his personal wealth courtesy of Roryal Dutch Shell, the international oil company.
Later, during my international consultancy careeer it became very clear that coruption was an important part of the global economic system and essentially outside the conventional systems of accounting and accoutability. It is pretty clear that corruption has a high return on investment, and almost all major international companies are implicated. When I worked to follow the money it was pretty clear who was getting the money, but much nore interesting was who was paying the money. Mostly it was people and companies that should have known better!
Around 2000, I learned something of the way in which the gold economy in Ghana functioned, and quite rapidly I found myself arrested and put in jail. Interestingly, some decades later, the person who was bothered by my inquities in now the Minister of Finance in Ghana and reported to be worht in excess of $250 million. When I crossed his path he was not worth very much at all!
Money profit and value performance not the same
Money profit and value performance not the same … they are very different. The economic elite and major decision makers have become comfortable with profit measures that ignore all the value destruction in society that enables profit making at its maximum. The profit money accounting metrics are convenient … but fundamentally wrong.
Activity and impact are different as well
Activity and impact are different as well … though many people doing academic studies and carrying out ORDA funded projects report mainly about the activities they have done rather than any impact these impact that may have been realized!
|
|
|
Stats on the Game … But What Game?
|
GO TOP
|
How about a better and better quality of life
If the game is better and better quality of life … then the metrics of performance should have a focus on this. Better and better quality of life is the way this game needs to be scored, and the way the game is played. The “stats” should be all in support of this game. This is about social value as well as about business profit … it is about values in society as well as money and material wealth.
More and more and more is NOT the game!
The dominant performance metrics are all about money and profit and economic growth based on more and more and more economic consumption. The end game for this system of metrics is a planet that no longer works to support humanity … but will appear “profitable” until it is “too late”.
More and more growth is the prevailing metric! This is a dangerous situation … consumption growth and profits are the top metrics and a path that will ultimately … and maybe quite soon end up with global value destruction on an unimaginable scale.
The main metrics for global economic performance are large aggregates and averages about growth and capital market performance. These metrics have some importance in aggregate, but do not inform decision makers adequately. The measures used for global economic performance are interesting, but not very useful. They have connection with correlation … but do little or nothing to help with cause and effect and with making better decisions. TVM aims to change the mindset that economic performance is about more and more but is better when it is about improved quality of life for society.
|
|
|
Progress and Performance of a BUSINESS
|
GO TOP
|
|
The conventional wisdom in recent times has been that a company exists to make profit for the investors. This is convenient for investors and owners, but everyone else is ignored and in the end the singular focus on investors is unsustainable. Business organizations are very important because they dominate the economic dimension of the socio-enviro-economic system and it is their performance that will determine progress in both the social and environmental dimensions of the system.
|
|
Progress and Performance of a BUSINESS
|
Open L0700-PP-OG-Business
|
|
|
Progress and Performance of a NOT-FOR-PROFIT
|
GO TOP
|
|
The not-for-profit organization depends for its survival on the availability of external money to sustain its work. This work may be very important, but in the prevailing conventional socio-enviro-economic system it has no inbuilt economic sustainability even though its work may have social value and environmental value.
|
|
Progress and Performance of a NOT-FOR-PROFIT organization
|
Open L0700-TVM-PP-OG-Not-for-Profit
|
|
|
Progress and Performance of a PERSON
|
GO TOP
|
|
The socio-enviro-economic system will do best when PEOPLE are the priority both as beneficiaries and as contributors and also as decision makers. In the end people make all the decisions and the system should enable people to make good decisions both for themselves and for everyone else.
|
|
Progress and Performance of an INDIVIDUAL
|
Open L0700-TVM-PP-Individual
|
|
Progress and Performance of a FAMILY
|
Open L0700-TVM-PP-Family
|
|
|
Progress and Performance of a PLACE
|
GO TOP
|
|
The characteristics of a PLACE have a major impact on people and their quality of life. People and organizations can move, but a place is permanent. People live in a place and it is in the place that everything must come together.
|
|
Progress and Performance of a PLACE (TO COME)
|
Open L0700-PP-Place
|
|
|
Progress and Performance of a COMMUNITY
|
GO TOP
|
|
A community is an instance of a place. A community has a human scale while a place may be much larger incorporating multiple communities.
|
|
Progress and Performance of a COMMUNITY (TO COME)
|
Open L0700-PP-Community
|
|
|
Progress and Performance of a PRODUCT
|
GO TOP
|
|
Products are important and the foundation for the material dimension of human quality of life. There are major differences between societies where shortage prevails and where there is abundance or surplus. There are no economic limits to how much can be produced, but there are serious limits imposed by natural systems which until recently have been ignored. In the end, efficient consumption of producxts is essential.
|
|
Progress and Performance of a PRODUCT
|
Open L0700-PP-Product
|
|
|
Progress and Performance of PROGRAMS and PROJECTS
|
GO TOP
|
|
In many organizations (like the World Bank, the UN and Governments) the program or project is the implementing entity. They have a major weakness in that mostly they are time limited and disappear at completion. As they disappear, any ability to have accountability disappears as well. Very convenient but a big reason why many programs and projects do not perform.
|
|
Progress and Performance of a PROGRAM
|
Open L0700-PP-Program
|
|
Progress and Performance of a PROJECT
|
Open L0700-PP-Project
|
|
.
|
|
SUCCESS
|

|
This is an interesting image about the landscape
It is a poor representation of what has to happen for an individual or an organization to achieve success.
|
|
|
Compared to POTENTIAL
PROGRESS and PERFORMANCE is POOR
|
GO TOP
|
The POTENTIAL of modern KNOWLEDGE
The amount of knowledge has been growing exponentially for a very long time ... and in the past 50 years the amount of new knowledge has exploded.
Compared to the growth in knowledge the actual progress of the socio-enviro-economic system has been very modest.
Worse ... far too much of the knowledge has been applied in ways that have had the effect of impeded socio-environment progress for many while giving excessive benefit to a limited group of beneficiaries. Over time the level of inequality has become dangerously unstable.
|
The UTILIZATION of modern KNOWLEDGE
Modern knowledge has been applied in many ways that have been good for some and very bad for others. There are many examples:
- The increasing power of technology to destroy, and the relative weakness of technology to achieve and maintain peace
- The gaming of the system in order to creater financial capital while social capital and natural capital are exploited and destroyed
- The increased abiity to communicate rapidly and the growth of dataflows without much related growth in understanding
- Too much information enables users to choose their information to suit their prejudices. Freedom of speech being abused to misinform without limit.
|
PROGRESS (SUCCESS) IS COMPLEX

|
Activites in the real world are very, very complex, and quite disorganized.
What is the best way to manage progress and performance in the reality of complexity?
Start by measuring progress.
Progress is the CHANGE in STATE between the BEFORE situation and the AFTER situation.
Look at the following graphics.
Understanding and measuring anything meaningful in the squiggles that represent the multitude of activities that are going on in any period is a huge task ... but measure the STATE before and after in comparatively simple and gives a very clear indicator of progress.
|
TPB note: My personal experience has been that it helps to have clarity about the goals. Historically companies have been very clear about the goal of improved profit performance, and as a CFO I wanted to be able to report periodically on profit improvement. In order to get to this outcome, the reality of the company's operations was complex and not always in the right direction. The company needed data that would inform ALL the decision makers throughout the organization how they were performing and how this was likely to impact the profit. My experience has always been that everyone will attempt to make better decisions when they have useful facts and know that performance is in fact being monitored in a fair and impartial manner. Better yet, when data about factual reality and performance are visible (transparent) then many individuals will outperform what was teh accepted norm simply because they know better than anyone else what actually works! With visibility, these outperformers can be recognised ... it may be financial reward, but non-financial reward also has important value.
|
|
THE PROBLEM WITH CONVENTIONAL ACCOUNTING
|
The problem with conventional accounting
The problem with conventional accounting is that while it does a very good job for money based transactions, it ignores all the impact that is not measured with money and included in the core transaction.
Since the beginning of the industrial revolution, the growth of financial wealth has come about while human capital has been exploited and natural capital has been depleted. When the global economy was quite small in size, the natural capital depletion did not represent an existential threat, but the scale of the modern industrial activity has now reached a level where natural capital depletion is a significiant risk.
|
|
TVM takes into account ALL the CAPITALS
|

|
TPB Note: This conceptual framing was articulated a long time ago with a slightly different naming convention. The important idea is that ALL the capitals are taken into account, how they are segmented and described is of lesser importance.
The current framing of the capitals is now (1) Social Capital, (2) Natural Capital, and (3) Economic Capital.
Social Capital is a slightly broader definition than Human Capital, but esssentially much the same;
Natural Capital incorporates the idea that the Sun is the source of all energy on planet earth; and
For the current framing, Economic Capital includes both Financial Capital and what is called here, Man Built Capital. Economic Capital comprises, Financial Capital. Physical Capital and Intangible Capital.
Financial Goodwill and financial intangibles straddle both the financial capital subset and the intangible capital subset.
|
SINCE THE 1980s FINANCIAL PERFORMANCE HAS BEEN OPTIMIZED TO BENEFIT OWNERS AND TOP MANAGEMENT WHILE BROADER SOCIAL AND ENVIRONMENTAL ISSUES HAVE BEEN IGNORED. MORE AND MORE, THE NEED FOR IMPACT REPORTING IS BEING RECOGNIZED ... BUT NO SYSTEM OF NUMBERING HAS YET EMERGED THAT IS EASY AND WIDELY ACCEPTED.
THIS IS WHAT TVM AIMS TO DO!
|
|
Many economic / financial metrics show growth and are considered good
|

Stock market
|

Intangible value
|
Stock market up ... Intangible valuation up
The underlying physical value of the modern economy has grown quite slowly compared to stockmarket valuation.
This is caused in large part by high business productivity and profits while the flatlining of worker remuneration.
|

Money supply
|

Value of the US$
|
Money ... Quantity up / Value down
Few people understand money and the monetary system, but 'trust' that money has value. This trust is reasonably well founded when money is used for transactions, but less so when it is thought of as a stroe of value.
|

World GDP growth
|

US GDP growth
|
The Stupidity of GDP
The financial media, politicians and policy makers talk about GDP growth all the time. They don't seem to understand that GDP growth has a very dangerous correlation with the existential risk of ecosystem collapse.
|
|
Metrics about social performance are less positive and unaddressed
|

GDP v GPI
|
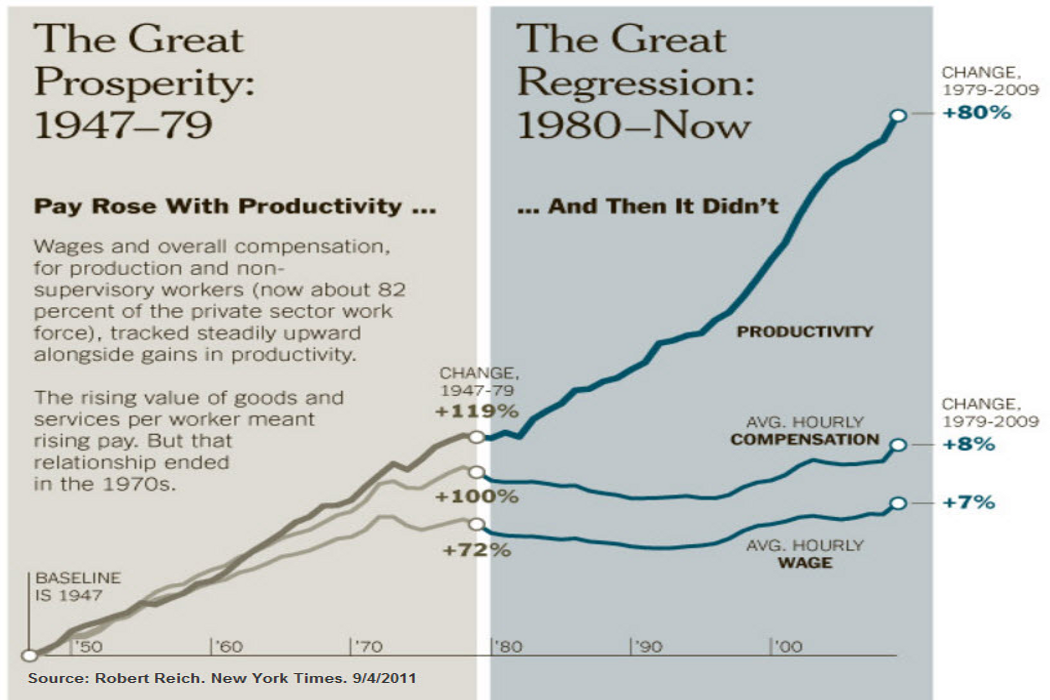
Wages flat
|
GDP v GPI and the flatlining of wages
The Genuine Progress Indicator (GPI) shows the weak progress of society compared to the growth of the GDP indicator. Since the 1980s productivity and profits have increased, but wages have flatlined. But it is worse, consumption growth and profits were enabled by massive unsustainable increases in consumer credit.
|
|
SOCIAL PROGRESS INDICATOR (SPI)
|
|
.
|
SPI - v - GDP per Capital by Country

The graph shows very clearly that there is a strong correlation between GDP growth and the Social Progress Index (SPI) at lower levels of GDP per capita, but that this changes when GDP reaches higher levels.
Costa Rica is one of the outliers. This is a country with relatively low GDP but a high SPI
Saudia Arabia, United Arab Emirate and Quatar in the Middle East are also outliers with very high GDP per capita but quite low SPI.
The United States has a high GDP per capita, but among the OECD countries has perhaps the lowest SPI.
|
|
Metrics about environmental issues are alarming and also unadressed
|
 CO2 concentration
|

Temp v CO2
|
GHG concentrations up / Global temperatures up
The correlation between GHG concentrations in the atmosphere and temperature rise around the globe is very strong. The idea that emissions associated with the industrialization that has happened in the last 200 years has not had a significant role in this is preposterous.
|

CO2 emissions
|
|
Greenhouse gas emissions (GHGs) continue to rise
Carbon dioxide equivalent (CO2e) emissions are going up less quickly, but that is not enough to avoid ecosystem catastrophe. As long as the managers of financial wealth have a singular focus on the growth of this wealth, the system will not change ... and it must.
|

Sea level rise
|
|
|
|
INCOMPLETE ... WORK IN PROGRESS
|
|
Economic and financial metrics show growth and therefore considered good
|
World GDP growth
|
US GDP growth
|
|
Using GDP as the measure, economic growth has been robust
|
Stock market
|
|
|
Stock markets recording strong price increases
|
Intangible value
|
Money supply
|
|
However, most of the recorded value add is intangible
A significant part of the economic growth comes from modern financial engineering which has allowed the creation of massive amounts of intangible value. Whether or not this constitutes real wealth has really not been challenged, but it is a framing of wealth that is very different from gold and tangible physical assets.
|
|
... but social metrics are not keeping pace ... not getting better ... even deteriorating
|
GDP v GPI
|
|
|
Though profits and productivity have continued to rise during the past 50 years, wages have flatlined.
|
|
... and environmental metrics are deteriorating rapidly ... and dangerously
|
Temp v CO2
|
|
|
|
|
|
MEASURE and REPORT on UNSUSTAINABILITY
for ALL the ACTORS and ACTIVITIES
PEOPLE, PRODUCTS, PLACES, ORGANIZATIONS
|
|
|
|
