PROGRESS AND PERFORMANCE
SOCIAL
|
|
|
|
SIMPLE SOLUTIONS DO NOT WORK IN COMPLEX SITUATIONS
|
SOCIO-ENVIRO-ECONOMIC SYSTEM
PROGRESS AND PERFORMANCE
SOCIAL
CATASTROPHIC GROWTH IN INEQUALITY.
|
OVERVIEW
The modern socio-enviro-economic system has delivered a massive increase in financial wealth, most of which has been for the benefit of very few. In aggregate the economy has performed well, but at the expense of society, and a large part of the world's population is utterly disillusioned. In mature rich economies most of the wealth is at the 'top' with the middle class and below anticipating a lower standard of living rather than a better living standard. In developing economies starved for capital there are a myriad of problems and little idea of how these problems can be addressed.
In order for the system to be managed so that Society as a whole can progress, major changes in measurement are needed. With better metrics it is possible that some of the essential structural changes in the way the socio-enviro-economic system functions can be identified and implemented. Without apprpriate metrics, this will never happen.
Just look at some of the following socio-economic trends.
|
|
|
PRODUCTIVITY UP
but PROFITS UP and WAGES DOWN
Massive redistribution of wealth from workers to owners!
|
GO TOP
|
Productivity up ... Wages down!

|
Corporate economic efficiency is improving
A plot of productivity versus wage growth shows that since the 1970s, NONE of the benefit of increased productivity has gone to improving wages ... ALL of it has gone to profits and to the benefit of owners.
TPB Note: It concerns me that eminent economists have talked about this problem for more than 40 years, and yet there has been almost no action by policy makers or anyone else in leadership positions to do something to solve the problem. My conclusion is that powerful people who understand management are really very happy with the prevailing outcomes and do not want to do damage to the 'golden goose' and most of the people who have concern for the issues of society and the environment don't know much about how management works, and especially management information. This is the underlying premise of the TVIA initiative!
|
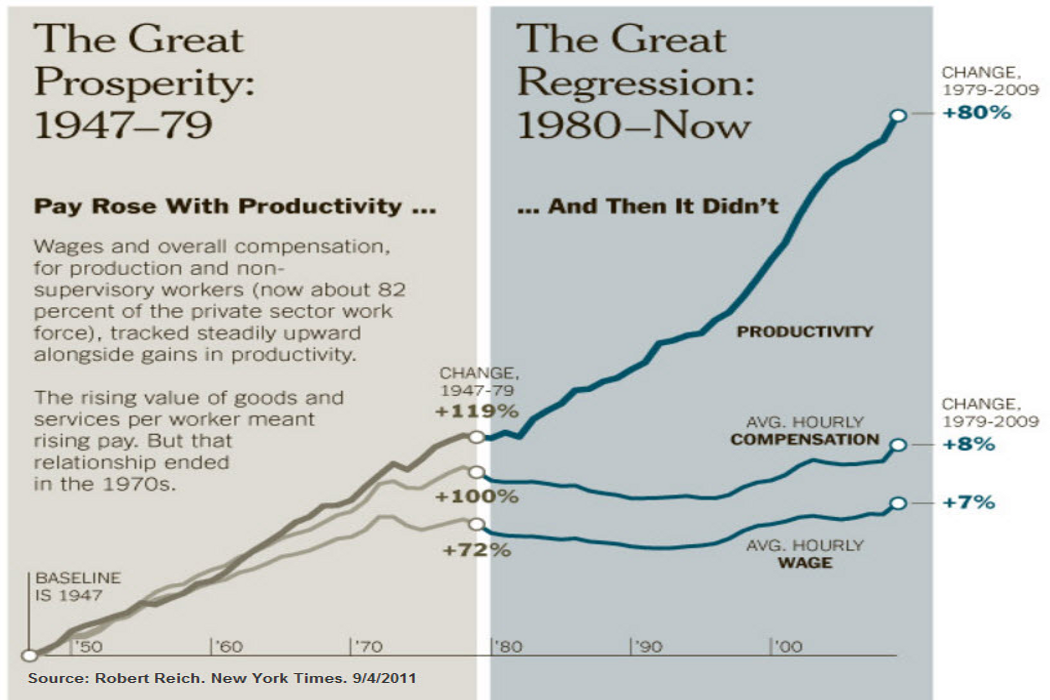
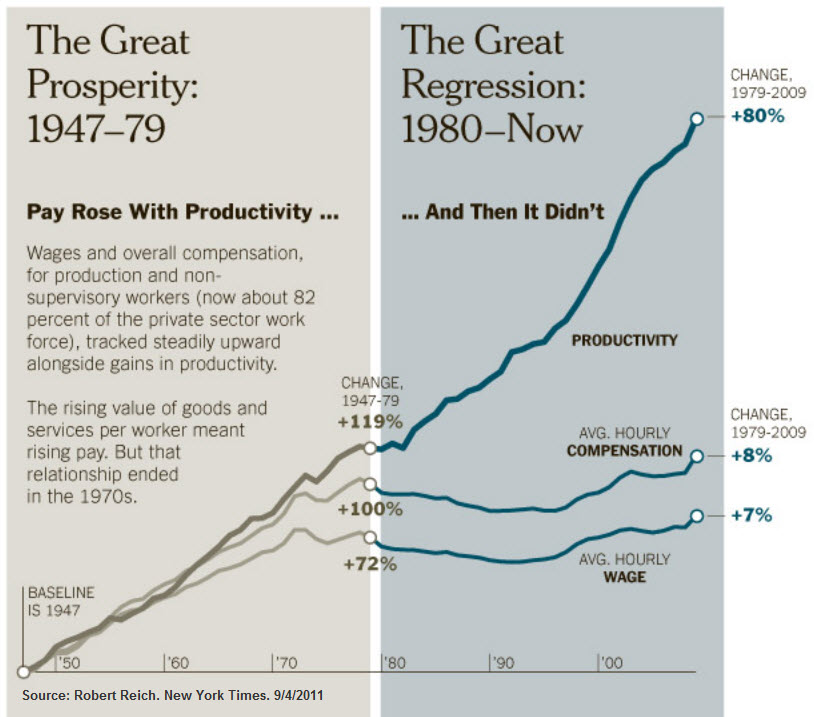
Productivity up ... Wages down!
|
Increased productivity does not result in higher wages
This graphic prepared by former Labor Secretary Robert Reich in 2011 shows the same basic information ... that NONE of the benefit of increased productivity has gone to improving wages ... ALL of it has gone to profits and to the benefit of owners. For more than 30 years all the benefits of improved productivity has gone to owners, with none going to those that work.
In contrast, in the earlier period 1945 to 1980 the growth of productivity was shared equitably between investors and workers.
|
|
|
|
CORPORATE RESPONSE TO PRODUCTIVITY INCREASE
|
GO TOP
|
Non-financial profits fluctuate wildly

|
This set of data (from Andrew McAfee) shows a modest growth in GDP for the USA from 1995 to 2011. In this period corporate investment increased but dropped as the economy went into a short recession after the post Y2K tech boom and again in the so called 'great recession' of the period 2007/8/9.
Non financial profits after tax has grown stongly from 1995 to 205 but with signficiant fluctuations with big drops in the 2000 recession and again in the great recession a few years later. Total profits after tax did not fluctuate as much as the financial sector fluctuated less even though it had a huge role in the financial crisis that was responsible for the great recession.
None of these economic indicators suggests an economy and a society in trouble ... rather it looks like a set of trends that are really quite good.
|
... but employment - productivity ratio has declined sharply

|
The problem is that when the productivity / worker trends are added in (the red line) then it shows that the achievements of the economy are being obtained with less and less participation of workers. It comes as no surprise that a political candidate such as Donald Trump is able to attract votes based on a promise of change, when a very large proportion of the country's worklers are 'losing' relative to the more advantaged in the society.
This is very basic economic analysis that seems to have been ignorded by politicians, policy makers and the media for a very long time.
|
Inequality in Brazil

|
Inequality
Very high end apartments next to low income neighborhood in Brazil
|

|
Very wealthy commercial and residential neighborhoods not far from poor slum dwellings in Brazil and highly polluted land.
The idea that trickle down economics actually works is a myth. The evidence is that wealth aggregates towards the top, the complete opposite of trickle down!
|
Inequality . The Gini Index 1917 - 2011

|
Inequality now at near record levels
There was massive inequality in the roaring 20s which was followed by the Great Depression of the 1930s.
Inequality was at its lowest level in the war years of the early 1940s and remained low until the 1980s when Reagan era deregulation and the weakening of unions became Republican public policy. By the time of the Great Recession and financial crisis of 2007/8/9 inequality as measured by the Gini index was almost as high as in the 1920s.
|
|
EMPLOYMENT / UNEMPLOYMENT TRENDS
|
|
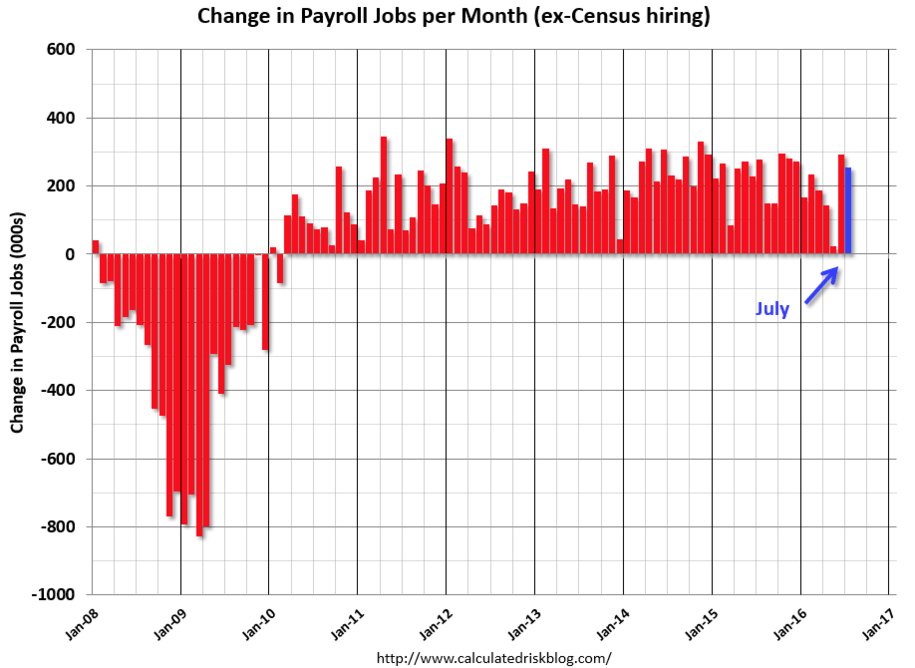
Job loss and job creation 2007 to 2016 by month
Job losses resulting from the Bush era great recession and financial crisis during the period from around January 2008 to December 2009 peaked at some 800,000 a month. Month by month from January 2010 to the end of the Obama administration, job gains were in excess of 100,000 a month with around 20% of the months more than 200,000.
|
|
|
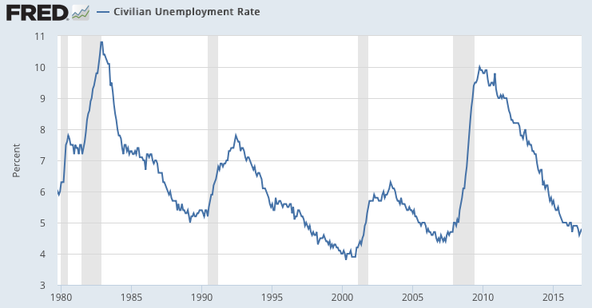
Unemployment rates 1980 to 2016 by month
Unemployment rates during the great recession and financial crisis of 2007/8/9 were higher than at any time since 1982 during the early Reagan administration.
There were significant increases in unemployment during the economic stress at the end of the Reagan era that required a reversal of policy by George H.W. Bush and then again another surge in unemployment at the end of the Clinton administation and the end of the dot.com bubble.
Unemployment at the end of the Obama administration is lower than at any time in the last 40 years
|
|
|
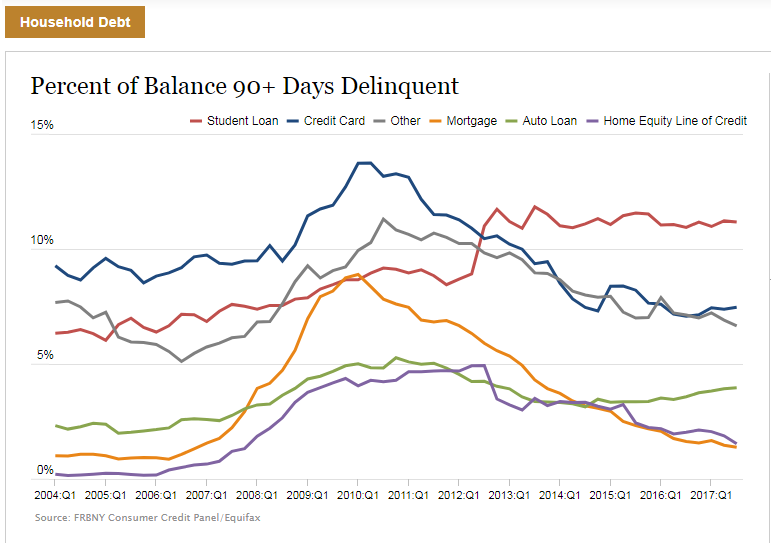
FINANCIAL BALANCE SHEET OF THE US HOUSEHOLD
|

|
Household Income -v- Household Debt
In the period from 1972 to 2010 Household Income has declined by a modest amount, while Household Debt has increased substantially.
It should be noted that this is an aggregate result for the country. Individual families are likely to be better or worse than this average, and in the case of those that are in a worse position the present state of affairs means that many families are in dire financial straits
In this period of nearly 40 years the ratio of household credit to earnings has more than tripled.
The problem is aggravated by the change in demographics during this same period. The population is aging, and most older households in the United States are woefully unprepared financial for their old age.
|
|
|
US DEMOGRAPHICS
|
|
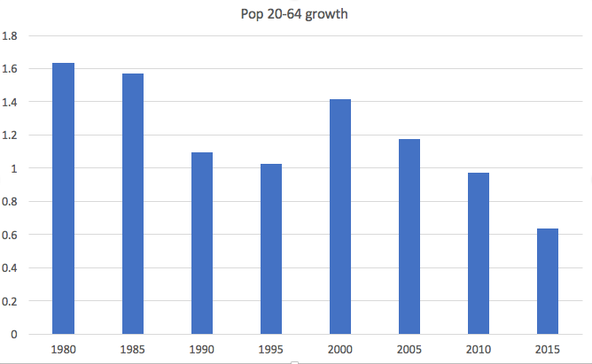
Working age adults in the US population
The growth in the working age (24-60) population in the 1980s exceeded 1.5%, but has declined significanly since then.
In 2015 the growth of this population was around 0.5%.
The growth of population is one of the components of GDP growth ... and especially the growth of the working age population. Many mature economies including the United States have aging populations which are also associated with significantly lower consumption.
|
|

576 434
|
|
|

750 531
|
|
|
|
|
|
|
|
|
The takeaway from these economic trends graphs is that decision makers have been able to make decisions that delivered benefit to owners (investors) while the population that works in the USA has been put to further disadvantage compared to prior decades. This is the result that one must expect as long as the dominent measure of economic success is money profit and money wealth accumulation. It confirms my belief that in order for the economy to be optimized for ALL the population there must be measures to reflect quality of life for everyone, and ont a single simple measure that really only works for those with affluence.
US GDP
All profits after tax
Non-financial profits after tax
Corporate Investments
|
This set of data (from Andrew McAfee) shows a modest growth in GDP for the USA from 1995 to 2011. In this period corporate investment increased but dropped as the economy went into a short recession after the post Y2K tech boom and again in the so called 'great recession' of the period 2007/8/9.
Non financial profits after tax has grown stongly from 1995 to 205 but with signficiant fluctuations with big drops in the 2000 recession and again in the great recession a few years later. Total profits after tax did not fluctuate as much as the financial sector fluctuated less even though it had a huge role in the financial crisis that was responsible for the great recession.
None of these economic indicators suggests an economy and a society in trouble ... rather it looks like a set of trends that are really quite good.
|
|
|
The problem is that when the productivity / worker trends are added in (the red line) then it shows that the achievements of the economy are being obtained with less and less participation of workers. It comes as no surprise that a political candidate such as Donald Trump is able to attract votes based on a promise of change, when a very large proportion of the country's worklers are 'losing' relative to the more advantaged in the society.
This is very basic economic analysis that seems to have been ignorded by politicians, policy makers and the media for a very long time.
|
|
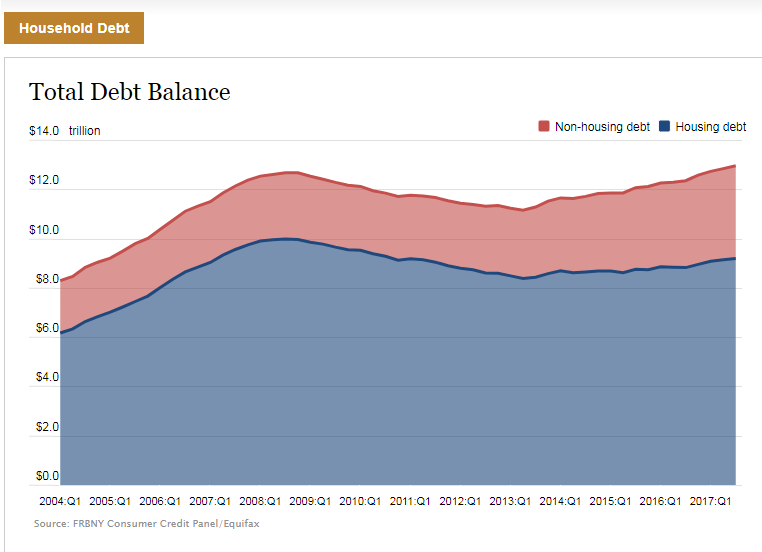
Housing Debt and non-Housing Debt
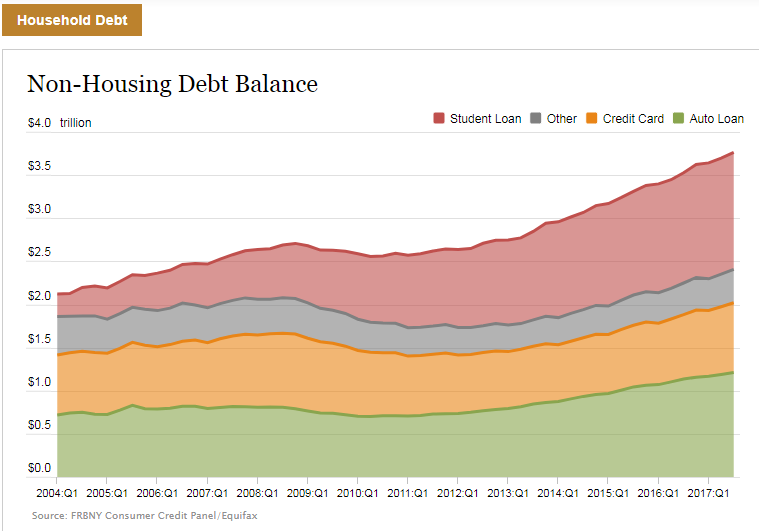
Components of non-Housing Debt
Debt Delinquency
US GDP
All profits after tax
Non-financial profits after tax
Corporate Investments
|
|
|


