Date: 2026-01-30 Page is: DBtxt003.php txt00004448
Metrics
Calvert-Henderson Quality of Life Indicators
Calvert-Henderson Environment Indicator ... Environmental Quality
Burgess COMMENTARY
Peter Burgess
Environmental Quality
The quality of the environment in the United States depends, in part, on the condition of the air and water that sustains humans and other living beings. Unfortunately, many of our everyday activities generate pollution harmful to our air and water. Emissions from vehicles, power plants, and industries that create the products we use are the main sources of air pollution. Runoff from roads and agriculture affects our water quality.
This section of the Calvert-Henderson Environment Indicator discusses the actual quality of the air we breathe and the water that we drink and use. We discuss the pollution sources and other forms of environmental degradation in detail in the other sections of the model (click on the model components to the left).
Air Quality
It's not possible to measure the quality of air on a continual basis at every point in the country. But the US Environmental Protection Agency (EPA) does measure air quality in many places, with monitoring stations in all 50 states, the District of Columbia, Puerto Rico, and the Virgin Islands. These stations measure the levels of six specific air pollutants: 1
- Ozone (O3)
- Carbon monoxide (CO)
- Particulate matter (PM)
- Lead (Pb)
- Nitrogen oxides (NOx)
- Sulfur dioxide (SO2)
Some Good News
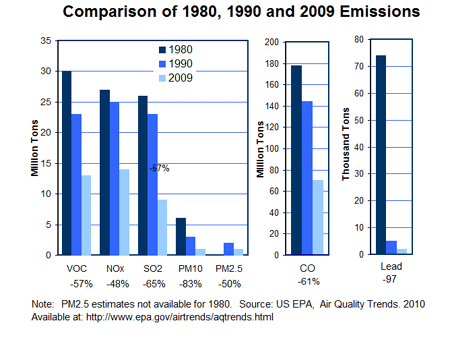
The good news is that from 1980 to 2009 (the last time the EPA released a National Air Quality Trends report), emissions of the six criteria pollutants had decreased by 60%. This is despite the fact that during the same time the economy, measured by gross domestic product, increased by 122%, energy consumption increased by 22% and vehicle miles traveled increased by 195%.2 Efforts to reduce emissions from industry, vehicles and power plants have been quite successful. The graph below shows the amount by which emissions of five of the six criteria pollutants and VOCs have decreased. Ozone is not shown in this chart because it is not emitted from any source, rather it is created by the reaction of NOx and VOC in the presence of sunlight as described below.

But There's Bad News Too...
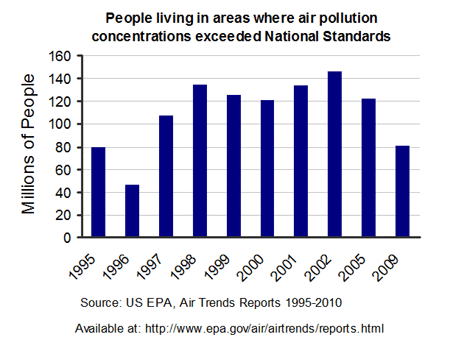
Because of the increase in population in the US, there are more people living in areas where air quality standards were exceeded for at least one of the six criteria pollutants at some time during the year. See the graph below.3

Ground-level ozone has been the slowest to improve.4 The environmental effects of ozone are different at ground level than in the stratosphere, where ozone forms a protective shield that blocks the sun's harmful ultraviolet (UV) rays. However, at ground level (also called the 'troposphere'), ozone contributes to respiratory-related and other illnesses. (For more information about the difference between ozone at ground level and in the stratosphere, see the EPA brochure Ozone: Good Up High, Bad Near By).
Although human activity does not generate ozone directly, it is created when volatile organic compounds (VOCs) and nitrogen oxides (NOx) react in the presence of sunlight and heat. VOCs are vapors of commonly used chemicals such as gasoline. NOx are generated by many human activities, including burning fuels in motors and motor vehicles. Ground level ozone levels will get worse if climate change causes summer temperatures to increase in US cities.5
Water Quality
Measuring the quality of water in the US is as difficult as measuring air quality. Water can be classified as surface water or ground water. It can be fresh water or salt water. It is used for drinking, for recreation, for agriculture, for manufacturing, and to support biodiversity and ecosystems.
Each type of water and each type of use involves different methods and standards for measuring quality. And, for an absolute picture of water, many different locations would have to be measured. In the US there are 3.5 million miles of rivers, 40.8 million acres of lakes, 34,400 square miles of estuaries (where rivers and streams meet the ocean), 58,000 miles of ocean shoreline, 277 million acres of wetlands and 33,000 trillion gallons of ground water!6
As you can see, it would be very difficult to have a single numeric measure of water quality. Instead, the EPA reports on how many different locations have been tested and whether or not the water quality is good enough to allow specific activities such as swimming, drinking, and fishing.
Water Quality Inventory
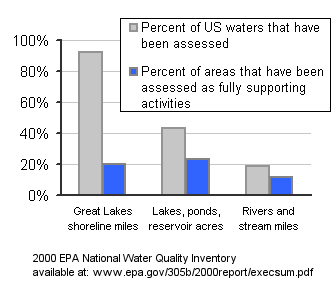
The latest report on overall water quality is the 2000 National Water Quality Inventory, released in 2002. The results were not encouraging, 41% of all the nation's lakes, rivers, streams, and estuaries were evaluated and 44% of the waters assessed were polluted. As seen in the graph below, the Great Lakes were the most completely assessed waters - 92% of the lakes' shoreline was evaluated but only 19% of those areas were designated as fully supporting the specific activities (swimming, fishing or drinking). A much smaller percent of other lakes and rivers were assessed; of those areas, closer to half were found to be swimmable, fishable, and drinkable.

The Ecological Health of Our Coastlines
A more detailed 2005 study of the health of the nation's estuaries found that the national coastal quality is only fair to poor. The EPA's National Coastal Condition Report II used data from 1997 to 2000, representing 100% of the estuarine areas (where fresh water rivers and streams flow into the salt water) in 48 states and Puerto Rico. The report looked at the ecological health of the estuaries based on the quality of the water and sediment qualities, contaminants in fish, the health of benthic organisms (plants, animals and bacteria that live in the water) and the quality of the coastal habitat.7
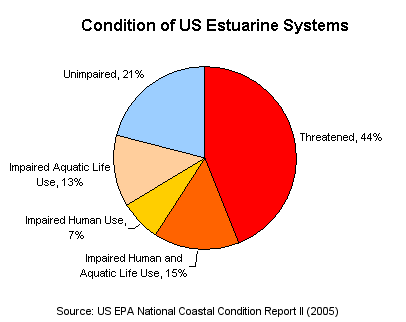
As you can see in the graph below, only 21% of the estuaries were unimpaired, while 35% were impaired for human or aquatic life, and 44% of the estuaries were threatened. In addition to affecting human health, estuaries are important because they provide habitat that supports 85% of waterfowl and migratory birds in the US.8

The quality of our air and water is a key factor in the condition of our natural resources, the next part of the Calvert-Henderson Environment Model. To see more information about environmental quality indicators, see our section on other Environmental Indicator efforts.
Footnotes:
- US EPA. January 2008. Latest Findings on National Air Quality -- Status and Trends through 2006. EPA-454/R-07-007 Research Triangle Park, North Carolina: US EPA Office of Air Quality and Standards Air Quality Strategies and Standards Division. Available at http://www.epa.gov/air/airtrends/reports.html.; US EPA. 2006. Where You Live. Washington, DC: US EPA. Available at http://www.epa.gov/air/airtrends/where.html. (accessed April 13, 2008)
- US EPA. Latest Findings on National Air Quality -- Status and Trends through 2006.
- US EPA. 2003. Draft Report on the Environment. Washington, D.C: US EPA. Available at http://www.epa.gov/indicators/roe/html/roeAirOut.htm. (accessed January 16, 2007); US EPA. September 2003. National Air Quality and Emissions Trends Report: 2003 Special Studies Edition. EPA 454/K-03-005. Research Triangle Park, North Carolina: US EPA Office of Air Quality and Standards Air Quality Strategies and Standards Division. Available at: http://www.epa.gov/air/airtrends/aqtrnd03.; US EPA. 1996-2003. Annual Reports on National Air Quality Trends. Available at http://www.epa.gov/air/airtrends/reports.html.
- US EPA. Latest Findings on National Air Quality -- Status and Trends through 2006.
- US EPA. Latest Findings on National Air Quality --Status and Trends through 2006.
- US EPA. August 2002. National Water Quality Inventory 2000. EPA-841-R-02-001. Washington DC: US EPA Office of Water.Available at http://www.epa.gov/305b/2000report/execsum.pdf.
- US EPA. December 2004. National Coastal Conditions Report II. EPA-620/R-03/002. Washington DC: US EPA Office of Research and Development/Office of Water. Available at http://www.epa.gov/owow/oceans/nccr/2005/index.html.
- US EPA. December 2004. National Coastal Conditions Report II.