Date: 2024-07-17 Page is: DBtxt003.php txt00004458
Metrics
Calvert-Henderson Quality of Life Indicators
The Calvert-Henderson Public Safety Indicator
Burgess COMMENTARY
Peter Burgess
The Calvert-Henderson Public Safety Indicator examines how effectively our society promotes safety as measured by those instances when we have failed to prevent outcomes that result in death or injury. While some might expect an indicator on safety to be about crime, we take a different approach. The vast majority of injuries and deaths in the United States stems from events that do not fall into the common definition of crime. Safety means more than the absence of crime. It means a safe physical environment, including safe products and safe roadways.
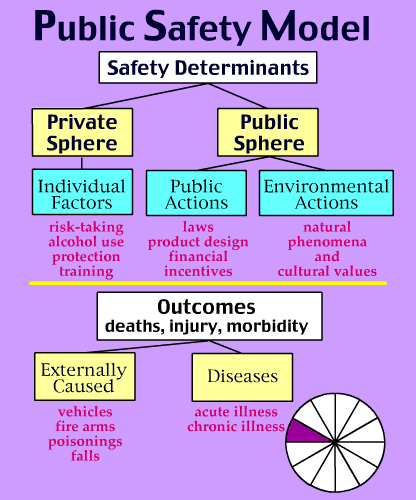
The Calvert-Henderson Public Safety Indicator identifies: (1) several important features of individual action within the private sphere that affect the probability of injury and (2) specific environmental and public life-saving actions (beyond individual control) that impact our safety and potential for harm. We highlight ways to reduce or avoid some of these hazards through collective action, which sculpts our cultural values.
Supporting safe personal behaviors has always been an important part of improving the safety of our population. But it is also necessary to acknowledge what can be improved in the public sphere. Reducing deaths and injuries from cars and guns, the leading causes of death from injury, will require changes in the public sphere. To do so, we need to foster cultural values that support public action as well as personal behaviors as essential determinants of safety.
Public Safety Expert: Dr. Trudy Karlson
Update on Public Safety in the United States
Table 1. Ten Leading Causes of Death in the U.S. (2009)
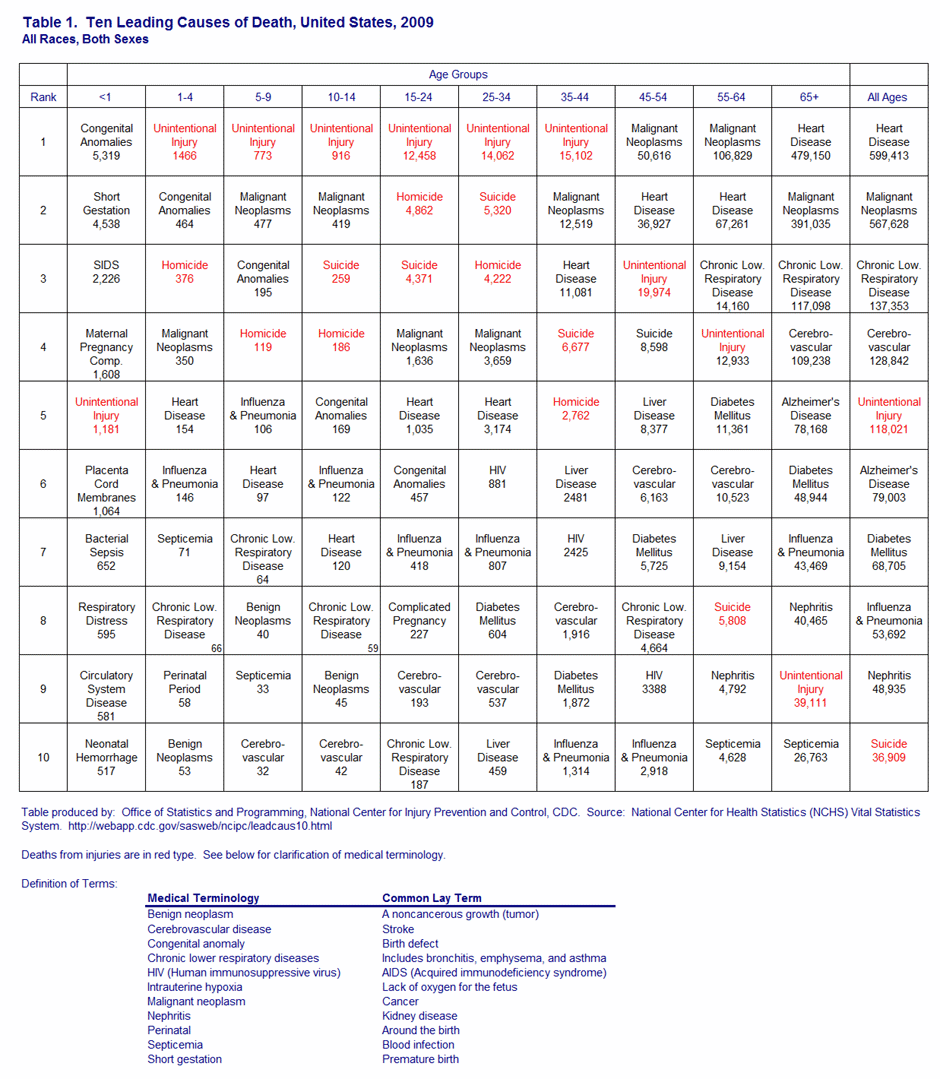
Figure 1. Death Rates from Injuries and Infectious Diseases (1910-1998)
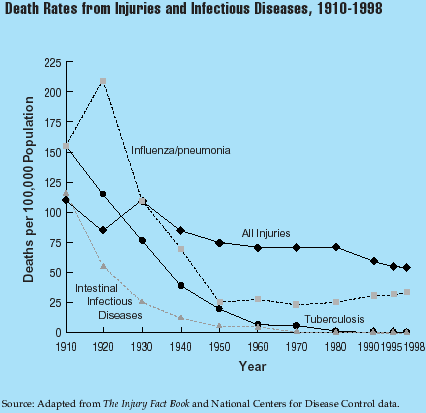
Figure 2. Years of Potential Life Lost Before Age 65 by Cause of Death (2009)
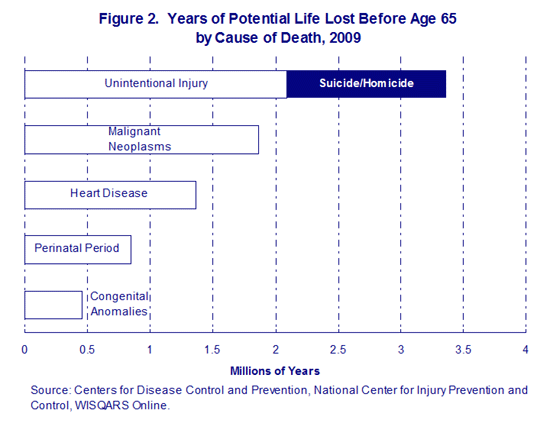
Table 2. External Causes of Deaths from Injuries (1997-2009)
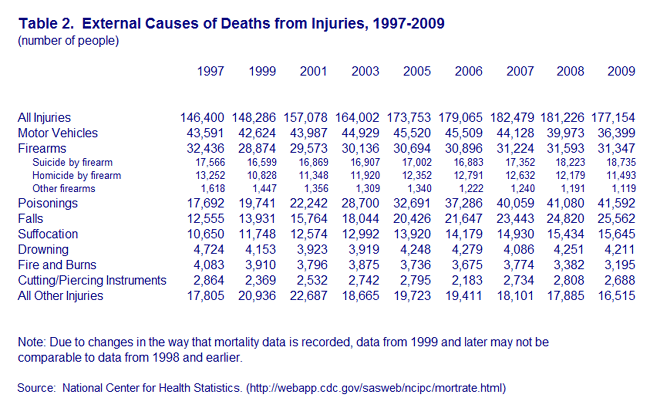
Figure 3. Death Rates from Injury by Cause (1981-2009)
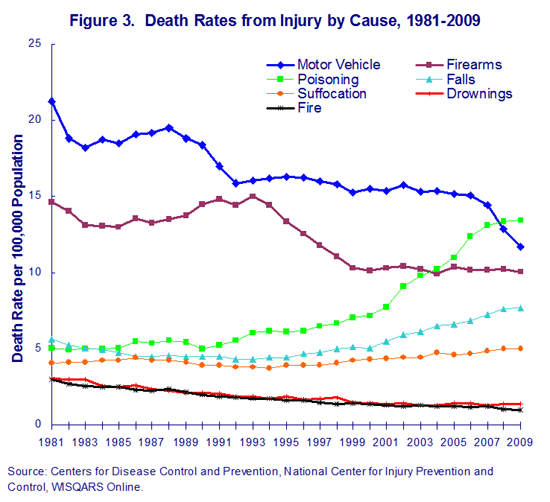
Figure 4. Death Rates from Motor Vehicle Crashes and Firearms (1981-2009)
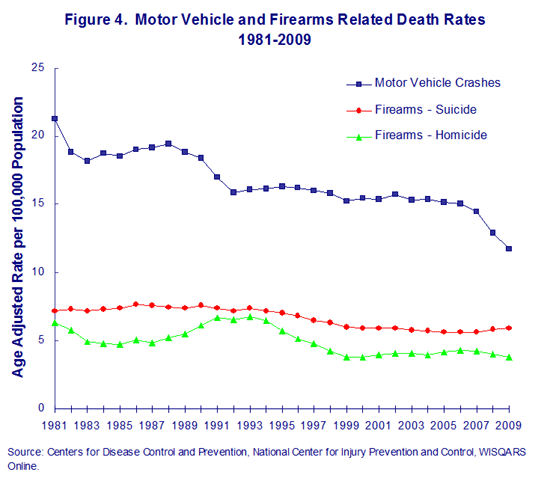
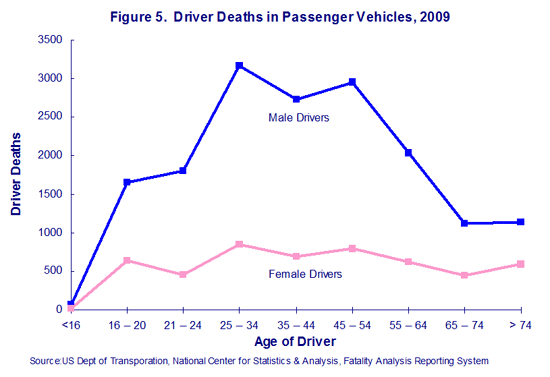
Figure 5. Driver Deaths in Passenger Vehicles (2009)
