
Date: 2024-09-27 Page is: DBtxt003.php txt00009492
Issues
Biocapacity
Ecological Footprint versus Biocapacity ... the Case of China and the United States
Burgess COMMENTARY
Peter Burgess
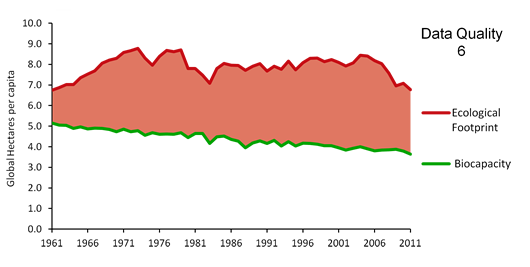
This graph tracks the per-person Ecological Footprint and biocapacity in United States of America since 1961. Both are measured in global hectares. Biocapacity per person varies each year with ecosystem management, agricultural practices (such as fertilizer use and irrigation), ecosystem degradation, and weather, and population size. Footprint per person varies with consumption amounts and production efficiency. Where a dotted line is shown, interpolation estimates have been used in place of highly unlikely outliers in the results. While most input data for the Footprint accounts come from UN statistical sources, the quality of country results varies. The quality of the assessment is scored on a 1-6 scale, and is provided for United States of America in the upper-right corner of the graph.
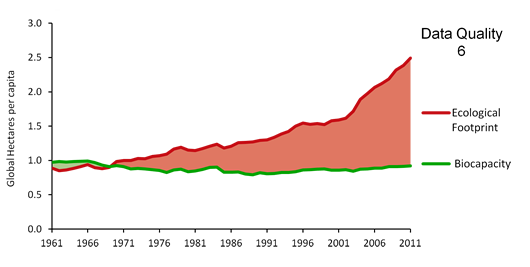
This graph tracks the per-person Ecological Footprint and biocapacity in China since 1961. Both are measured in global hectares. Biocapacity per person varies each year with ecosystem management, agricultural practices (such as fertilizer use and irrigation), ecosystem degradation, and weather, and population size. Footprint per person varies with consumption amounts and production efficiency. Where a dotted line is shown, interpolation estimates have been used in place of highly unlikely outliers in the results. While most input data for the Footprint accounts come from UN statistical sources, the quality of country results varies. The quality of the assessment is scored on a 1-6 scale, and is provided for China in the upper-right corner of the graph.
A quick look at these two graphs suggested a little analysis needed to be done. This is the result: