
Date: 2025-04-07 Page is: DBtxt003.php txt00015357
Energy
Oil Price Economics
The Oil Price Roller Coaster ... information from 2015
Burgess COMMENTARY
Peter Burgess
The Oil Price Roller Coaster

Oil’s place in the global energy mix is transforming, including in mobility, which uses three-fifths of world oil. Image copyright Thinkstock / curraheeshutter.
Why do oil prices go down? Because they went up. Why do oil prices go up? Because they went down. That’s what they do. To avoid oil-price volatility, you must kick the oil habit.
You can do this by switching to efficiency and renewables. You’ll get cheaper energy services at steady prices; free price insurance; and lower risks to climate, health, environment, global development and security, and America’s independence and reputation.
In contrast, the oil for which the U.S. pays $1 billion a day — and paid $2 billion a day until mid-2014, when $100+ per-barrel prices halved — comes with price risk and far bigger hidden costs that at least triple the real societal cost to upwards of $4 billion a day.
So why, after four relatively placid years, did the world oil price tumble starting in mid-2014, and what’s next?
Why Oil Prices Fluctuate
People burn 1.3 cubic miles of oil a year, or 93 million barrels a day (each barrel equal to 42 U.S. gallons or 159 liters). Scott Pugh, energy advisor to the Department of Homeland Security, visualizes those barrels, each 20 inches in diameter, laid end-to-end and joined to form a pipeline. It’d stretch 1.8 times around the earth. To traverse that pipeline in 24 hours, the oil must flow at 1,835 miles per hour — 2.44 times the speed of sound.
Crude oil’s price fluctuates at more like the speed of light, varying with global, regional, local, and firm-specific market conditions. Despite many complexities, some broad observations are usually valid.
Oil prices tend to rise with instability in major exporters — Persian Gulf, Nigeria, Venezuela, Russia — though diversified supplies, suppliers, and delivery routes have made markets more placid. Strong economic growth also tends to raise prices — until they get high enough to dampen or reverse the economic growth. Conversely, oil prices fall when major exporters do what John D. Rockefeller used to do regularly: “sweat the market” with oversupply to bankrupt high-cost producers and thus raise one’s own monopoly rents.
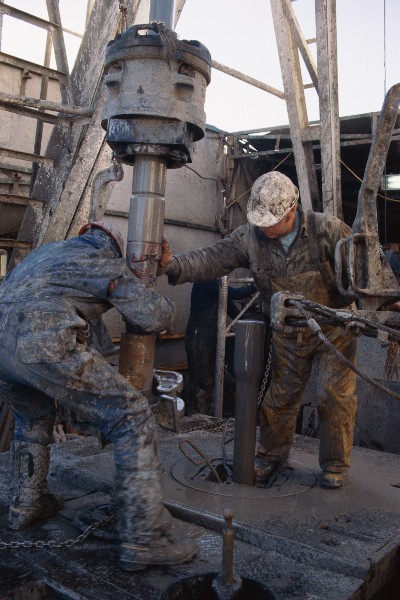
With cheaper per-barrel oil prices and global oversupply, high-cost producers are being severely tested. Image copyright Thinkstock / Stockbyte.
Causes of the Current Price Drop
Instability and surplus are both occurring today, but surplus is proving more important. The world market is glutted with several million extra barrels per day (Mbbl/d), mainly from fracked U.S. oil and Canadian tar sands. The U.S. is now the world’s largest oil producer, with output at a 31-year high.
Late last year, the Saudis and allies announced they wouldn’t cut output to rebalance the market as they had in the past. Why should they? They’d simply give up market share to higher-cost producers. And the Saudis didn’t cause the imbalance; North Americans and other non-OPEC members did.
Until recently, only the Saudis (and to a lesser extent their Gulf allies) had big surplus production capacity, and at the world’s lowest cost. Saudi oil costs about one-tenth as much to extract as fracked U.S. oil or Alberta tar sands need to break even. Now an added reality is roiling markets: only the Saudis have enough cash to weather a prolonged price drop. While Iran, Iraq, Venezuela, Russia, and Nigeria are financially stressed, the Saudis claim 2.5 Mbbl/d spare oil capacity and $0.7–0.9 trillion of monetary reserves — enough to sustain several years of $50 oil and keep funding their $40-billion renewable-power program (meant to save oil for export).
To avoid oil-price volatility, you must kick the oil habit. Yet we still burn 93 million barrels each day.
Against that backdrop, competitors are fish in a barrel. The biggest oil companies’ capital expenditures quintupled since 2000 but their production barely budged. That’s a seriously diminishing return per barrel at any price, let alone lower prices that undermine profitability. When oil prices suddenly fell nearly 60 percent in seven months, firms frantically cut costs and axed massive Arctic, deepwater, and other high-cost projects. In what analysts Wood Mackenzie call “the biggest threat to oil and gas industry earnings and financial solidity since the financial crash of 2008,” investments may fall by $200+ billion this year.
Tar-sand and fracking operators will be severely tested: frackers in the oil-rich Bakken are producing a gusher of red ink despite falling service costs and continuing technological improvement. Even those North American operators who survive the downturn may lose skittish investors to safer pursuits — such as renewable power, whose lower risks now attract capital several percentage points cheaper than utilities get. It was, after all, the former Saudi oil minister, Sheikh Ahmed Zaki Yamani, who famously said, “The Stone Age did not end for lack of stone, and the Oil Age will end long before the world runs out of oil.”

The Demand Side Strikes Again
All this talk of oversupply is lopsided, though, because it leaves out half the supply/demand balance. The tepid global economy, with deflationary pressures in Europe and Japan, slowing growth in China, political gridlock in the U.S., and the gloom of uncertainty everywhere, continues to weigh on oil demand. But so, very importantly, does the invisible “fifth fuel” — energy efficiency, which the International Energy Agency recently found is even bigger than any other fuel.
Rich countries’ oil use peaked in 2005. Developing countries’ oil demand is moderating. Start with mobility, which uses three-fifths of world oil. Strong auto efficiency standards already widely adopted (including China and India) will keep gasoline demand subdued or even shrinking, despite sharply lower fuel prices.
U.S. driving has been falling since 2007 and hasn’t rebounded with nearly halved gasoline prices. Bloomberg New Energy Finance (BNEF) notes that in the past 10 years, Americans’ driving fell 10 percent below trend, while in the past 13, their vehicles got 29 percent more efficient. Result: innumerable negabarrels.
Thus, what’s normally described as an oil supply surplus is at least equally a shortfall in forecast demand. Suppliers invested to meet demand that’s not there. The resulting oversupply pushes prices down relentlessly. This deflation could be quite persistent. As the International Energy Agency said on 16 January 2015, “It is clear that the market is undergoing a historic shift. OPEC’s embrace of market forces…is a game changer… Oil’s place in the global energy mix is also transforming… [T]he next few years could…prove a period of reckoning for a market and an industry that, through the course of their 150-year history, have had to periodically reinvent themselves.”
The Stone Age did not end for lack of stone, and the Oil Age will end long before the world runs out of oil.
In short, the oil industry pays far too little attention to demand. As my November 2014 Shell paper “Efficiency: The rest of the iceberg” explains, suppliers can run their tankers into that iceberg and sink without ever knowing what they hit, because it’s not on their chart and they’re hardly tracking it. The notion that countries like the United States could profitably eliminate oil use by 2050 (see RMI’s Winning the Oil Endgame, 2004, and Reinventing Fire, 2011) may be novel, yet huge and lucrative oil savings aren’t: they’re well demonstrated but conveniently ignored.
Underlying Oil-market Dynamics
Oil prices have yo-yoed persistently since 1973. Graphing world oil use vs. price reveals multiple loop-the-loops when oil prices rose so high that efficiency, alternative supplies, and elastic consumer behavior shrank demand, crashing prices. Gradually demand regrew at lower prices until the cycle repeated. BP’s CEO warns that the oil industry now faces its deepest slump since 1986, and it’s a very deep slump indeed.
Meanwhile, the costly projects needed to find and exploit big new frontier oilfields often take a decade or more to build, while oil’s biggest competitors — including slumping demand through efficiency gains — can emerge much faster. This was revealed in 1977–85, when the U.S. cut its oil use per dollar of GDP by 35 percent. In those eight years, GDP rose 27 percent, oil use fell 17 percent, oil imports fell 50 percent, and imports from the Persian Gulf fell 87 percent.
The biggest U.S. contribution came when President Ford’s 1975 auto standards raised new domestic cars’ efficiency 7.6 miles per U.S. gallon (mpg) during 1977–85. They drove 1 percent fewer miles on 20 percent fewer gallons. The U.S. proved it could save oil faster than OPEC could adapt to selling less oil.
