
Date: 2024-12-21 Page is: DBtxt003.php txt00018687
Investment
Impact of Coronavirus on Stock Market
Today's Market | Market Outlook ... What Is Driving This Market Higher, And How To Play It
Peter Burgess
Summary
- The S&P 500 has rallied 24% from the March lows.
- There have been three rallies of 19% or more in the past two recessions.
- Technicals from the Fed likely are a major driving force behind this pop, which could fade in the coming weeks.
- Fundamentals no doubt are awful, but we cannot time market bottoms.
- Deploying capital in small doses into the market makes sense even now, as government stimulus shouldn’t be ignored.
- Looking for a helping hand in the market? Members of Cash Flow Compounders get exclusive ideas and guidance to navigate any climate. Get started today »
This has gone against the smartest investing minds I know and follow: Gundlach, Grant, Rosenberg, Marks, et al. I have been in the camp that we wouldn’t find a bottom for a while too, should this recession follow past ones.
David Rosenberg had this to say recently:
As I sift through the estimates for Q1 real GDP and the various forecasts for Q2, I can see how daunting the challenge is going to be for the future. We are going to be opening up a near-10% deflationary output gap that, under a very aggressive and ambitious set of recovery projections and tons of more government stimulus, will not close for at least three years…real GDP does not get back to the pre-shock trend-adjusted level until the Summer of 2023”Are suddenly the investing elite just flat wrong?
The answer is probably not. Closing down an economy is massively deflationary. While I am not sure it will take until Summer 2023 to recover, restarting an economy will take time, especially as we contemplate new social distancing measures and likely lasting changes to consumer spending patterns.
We may yet re-test market lows.
Bear market rallies of 19% or more have happened three times in the past two recessions.
Let’s look at a couple of them. Below is 2001 when the S&P 500 jumped 19%.
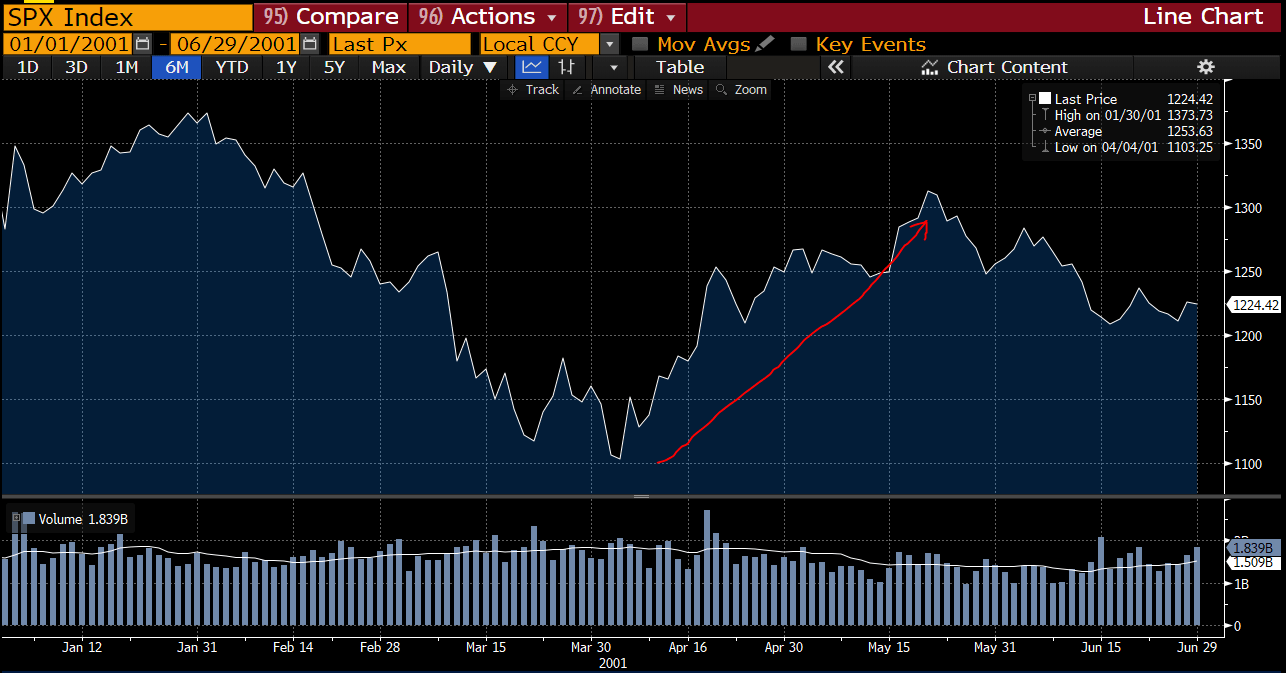
Source: Bloomberg
Below is another bear market rally, this one 25% at the end of 2008. The market turned around and fell 27% until finding a bottom in March 2009.
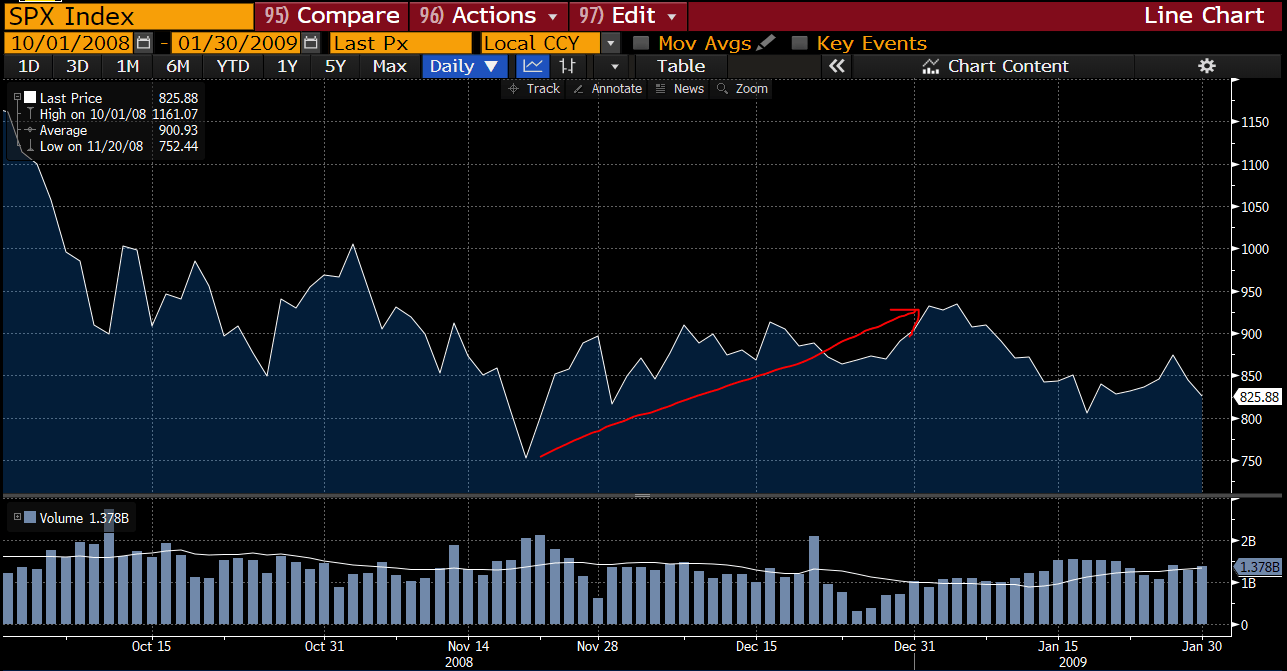
But let’s talk about timing for a minute. Interestingly, had you “chased” this rally in 2008/2009, and picked up the S&P index at say 925 in early January, then in a year, you would have earned 25% in returns going out to January 2010.
Had you waited until the recession ended in nine months, and not purchased the index until say September 2009, then you would have only made 11%.
Looking at the 2000-2002 recession, had you chased the 22% rally, and bought stocks on March 19, 2002 (at the end of the rally starting September 21, 2001), you would have lost 25% in the following year.
So which is the better historical precedent? Don’t both argue to wait to some extent?
To some extent, yes, both argue for waiting. But today we are leaning toward the 2009 scenario, as this recession and recovery will be driven by massive government intervention, which was sorely lacking on both the fiscal and monetary side back in 2000 to 2002.
While the doom and gloom crowd argue that GDP growth with be worse than anything we have seen since the Great Depression, they forget the size of government stimulus this time around.
Also arguing against a repeat of the long, slow bear in 2000 to 2002 are valuation levels heading into the crisis.
The dotcom bubble propelled equities to record high valuations, an eye popping 30x earnings on 2000 numbers.
Here is a chart of S&P P/E multiples going back 20 years.

S&P 500 Price/Earnings Multiples Chart
In 2007 heading into the Great Recession, S&P multiples were far lower than they were in 2000. Indeed, the S&P traded at about 17x earnings that year.
While not cheap per se at 20x this go around, there is far less a bubble to deflate valuation-wise.
For those of us in research during the dotcom bust, I can only say that the greed I witnessed then is most similar to the trading patterns in Tesla stock earlier this year. But it spanned across a far wider spectrum of names back then. Any company with a .com moniker, even those without viable business models, traded at insane levels.
The 2008 economic bubble was housing driven. The mania to buy homes with lots and lots of debt did not bleed over into stock valuations.
So while most bear market rallies tend to fade, we consider it prudent to buy steadily over the coming few months.
Below we'll compare government spending, interest rates and Federal Reserve behaviors to the Great Depression, Great Recession, and the dotcom bust.
Government Stimulus
Below is a chart of US deficit spending as a percentage of GDP from 1929 to 1971.
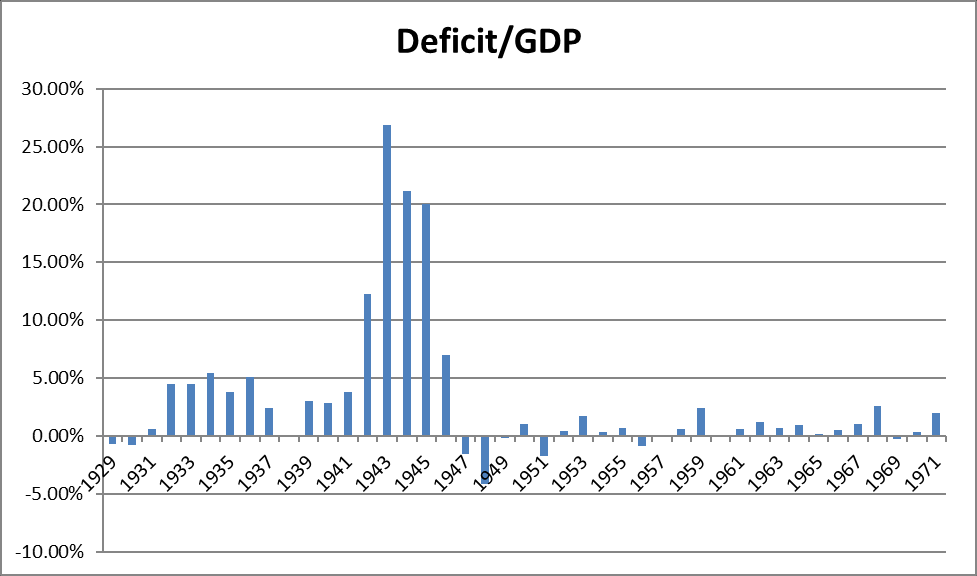
The bears argue today that our economy will ultimately resemble the Great Depression. But likely they have not taken government spending responses into account.
While GDP will fall in Q2 as badly as any quarter since the Depression, deflation ruled the day for three solid years in the 1930 to 1932 time frame (with CPI down roughly 10% per year). Bank failures wiped out savings of a substantial portion of the population too. There was no FDIC back then.
As you can see above, despite the times, the US government largely avoided deficit spending in the 1930’s. Keynesian monetarism had not taken hold yet as a policy.
Moving forward, in 2000, the US government actually ran a surplus. The go-go 1990’s economy, coupled with a spendthrift government (as dictated by deficit hawks), kept deficits quite low.
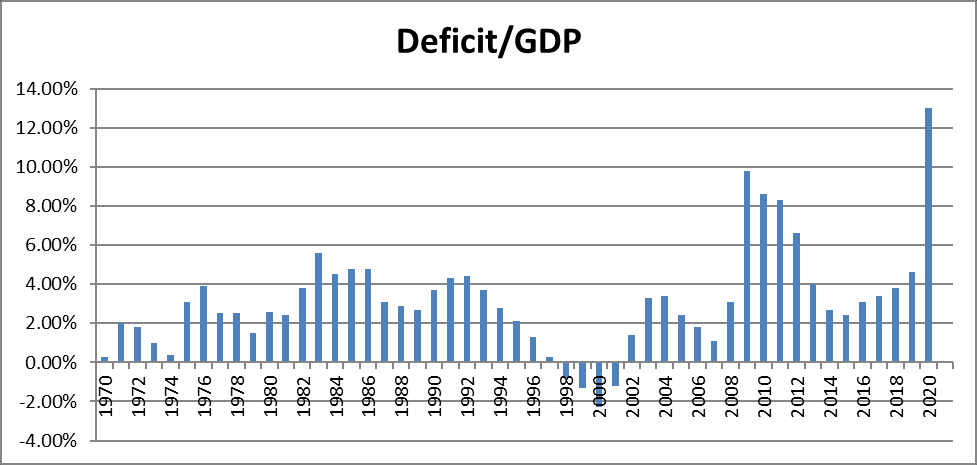
Source: data from governmentspending.com
Indeed, there was very little government response whatsoever to the bear market and recession of 2000 to 2002. With multiples starting at 30x, and no government or Federal Reserve rescue, the stock market took its time in finding a floor.
Recall also, the 2000 to 2002 bear market included two different events, the dotcom crash in 2000, followed by the events of 9/11.
In 2008 and particularly in 2009, both the Fed and the government came to the rescue. The 2008 stimulus bill totaled $800BB, or about $1TT in today’s dollars. Deficit spending as a percentage of GDP reached a whopping 10% in 2009.
It shouldn’t come as a surprise then that, far different from either the Great Depression, or the 2000 to 2002 bust, the Great Recession was resolved far more quickly.
This time, it is even more dramatic, with deficits expected to reach 13% of GDP this year, with a $2TT stimulus bill already passed. Discussions of another $1TT infrastructure bill or otherwise could take these numbers even higher.
Quantitative Easing (QE)
Like our recent stimulus bill, the Fed’s balance sheet has expanded in magnitudes well beyond normal, and even beyond 2008.
This chart below is from the Federal Reserve’s own website, federalreserve.gov.

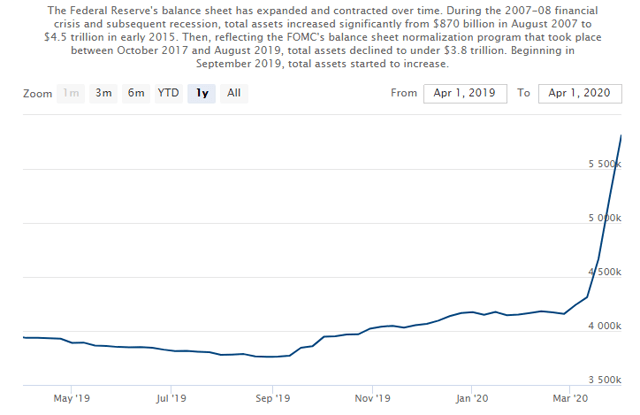
The Fed in a just a couple of weeks has already added over $1.5 TRILLION in assets to its balance sheet: Treasuries, commercial paper, muni’s, Agencies. Under their old QE regime, the Fed typically purchased $60BB to $80BB of bonds per month.
In just 14 days, the Fed has literally pumped almost two years of normal QE buying into the bond market.
Astonishingly, on Thursday (March 9th), the Fed announced another $2.3TT of incremental purchases, spanning a wide range of asset classes including:
- Asset backed securities (ABS)
- Commercial mortgage backed securities (CBMS)
- Leveraged Loans
- Municipal bonds
- High Yield (BB rated)
In 2008, the Fed pumped money $1.2BB into bond purchases, mostly Treasuries, but also munis and commercial paper.
The size of the Fed’s balance sheet peaked on December 17th, 2008. It is interesting to note that the market cratered 40% through November 15, 2008 (the end of the Capitulation phase marked by extreme volatility).
Then the S&P rallied over 25% through year end 2008 (bear market rally like now?).
Then the index dropped 27% to new lows in early March 2009 (is this next for us?).
Purchases by the Fed totaled $1.2TT in the 2nd half of 2008.
This year, total Fed potential buying will be borderline “unlimited.” With $1.5TT of purchases to date, and another $2.3TT potentially available to backstop a variety of struggling fixed income asset classes, simply unfathomable quantities of capital are flooding the markets.
As a side note, I spent quite a bit of time last week combing through Fidelity's corporate bonds offerings. The choices are slim. Whereas I expected to find dozens of easy 2-5 year duration bonds trading at interesting yields, the reality is that the risk reward of bonds look quite awful across the board.
Some big benchmark bonds like AT&T's 2025s (the 3.40%’s) trade at a measly 2.3% yield.
Not too long ago I sold my JPM 4.125s of 2026 at a ridiculous yield under 2%. Today they still only yield 2.4%.
I have also sold about half a dozen other investment grade corporate bonds since late 2019 and early 2020.
So, what happens when retail or institutional investors sell so many bonds (essentially to the Fed)?
Well, that cash is likely finding its way to the stock market.
Indeed, the market cap of all US stocks is $20TT.
The size of the bond market is over 2x as big, about $45TT.

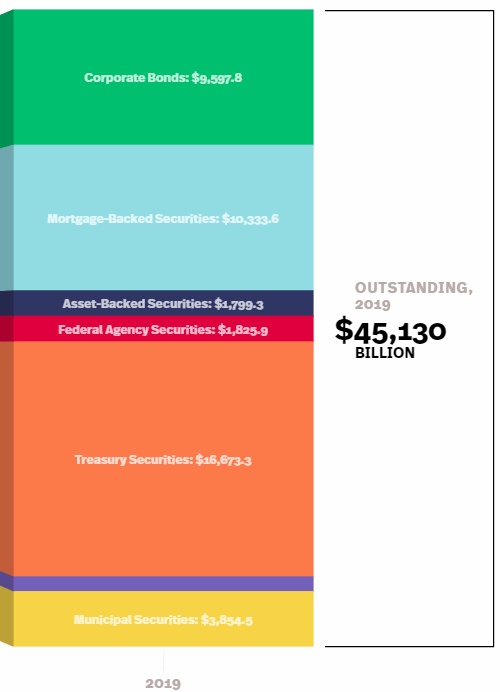
When the Fed pumps $1.5TT into bonds within three weeks, promises another $2.3TT, and vows to “do whatever it takes,” then they are buying insane quantities of bonds from somebody and probably everybody.
That $3.8TT in capital is 19% of the size of the entire US equity market.
That is a tremendous amount of equity-buying potential.
It perhaps shouldn’t come as a surprise that these capital flows have flipped the switch from panic selling, to panic buying in just a couple of weeks.
Interest Rates
Below is a chart of the risk free rate (the 10 year Treasury) going back to 1999.
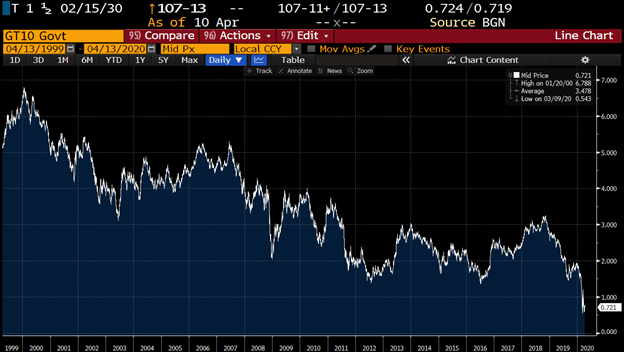
When interest rates are moving up, typically in conjunction with the Fed reducing the size of its balance sheet, liquidity is being drained from the system. We all know that higher rates mean that (ceteris paribus) valuations will fall.
That is, we all knows that an equity's value is merely the present value of their future cash flows. So if rates used to discount those cash flows go up, then stocks are inherently worth less (and usually equities fall).
Today of course the opposite is happening. The Fed taking rates to zero has substantial present value consequences for equities. Valuing stocks at a risk premium above the risk free rate suddenly is a very different equation when the risk free rate plummets. Ten year Treasury rates now hover around 60-70 basis points, from 2% not too long ago.
To give an example, I was running a net present value calculation on Akamai Technologies, assuming a 3% CAGR in free cash flow, and a 15x terminal value in 10 years. If I use the risk free rate from a month ago, plus a 4% premium, then I get an $84 present value for the stock, or one that should be trading at 21x earnings.
If I take the risk free rate down by 2%, then suddenly the exact same cash flows are worth $96 per share.
That gets me an NVP of 24x earnings, a 20% jump in the stock's valuation.
While arguably rates normalize higher and more rapidly than in a decade, lower rates, far lower than have ever existed in US recent history, argues for better multiples.
So....
The Fed is distorting not only bond markets and rates, but the spillover into equity markets likely has propelled stocks vastly higher than fundamentals support. I am not sure how to justify the S&P trading today at 20x earnings, especially in the face of a pretty horrific recession.
Earnings also will be much lower, and likely haven't adjusted yet to our new 2020 reality.
But the phrase “don’t fight the Fed” rings true. The market may continue rallying, until the Fed’s balance sheet growth stops.
So How Should an Investor to Play This?
In our last public piece three weeks ago, we argued that the we were approaching the end of the Fear and Capitulation phase.
Here is the same chart we published then.

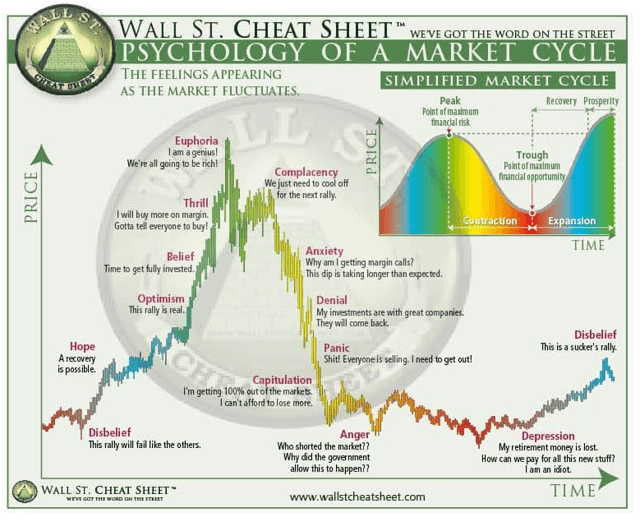
The Capitulation phase appears solidly over, with that bottom occurring on March 23rd. The VIX (volatility index) now has dropped to 43 from over 80, its lowest close since March 6th.
These are positives. The panic is over. There typically is a rally off of panicked markets, as selling is exhausted, and bargain hunters appear. You can see the chart above shows a typical swing back up after panic end.
Of course, bargain hunting conflated with massive Fed capital flowing into markets, have naturally exaggerated this rally.
But, once earnings kick in, and Fed QE slows, we could slip into the Despair phase as we call it, where stocks slowly drop amidst poor fundamentals.
That said, we honestly are not sure if the market finds a lower low, or simply drifts down 10-25%, as both micro and macro data come out. We peg some kind of bottom perhaps in the next 3 to 9 months, with a bull market likely to then take hold.
Indeed, if the Great Recession is the correct playbook, then the bottom should happen by late 2020 or early 2021, with a multiyear bull market likely afterward. But again, government intervention is multiples higher than at any time in history.
The best strategy?
Despite a somewhat near term dour outlook, we continue to recommend buying slowly, perhaps in even increments over the next nine months, in names that can recover quickly, and with good balance sheets.
Remember, buying the market is not the same as buying individual stocks. We look for specific opportunities to recommend. In fact, we wrote up half a dozen shorts in mid-January, and only 3 longs.
In February we wrote up only 2 longs and 4 sells/shorts.
In March, as the markets melted down, we began recommending buys starting March 17th, with 9 buys in total through month end. We have added 3 more long ideas in early April, and continue to find ideas worth pursuing, even if the market is getting ahead of itself.
We continue to recommend avoiding travel and leisure stocks, energy and/or companies with bad balance sheets.
Key insight: We cannot time market bottoms, and waiting too long will likely mean missing quite a bit of upside. Recall our math on 2009. Buying after the 25% rally then still produced far better total returns then waiting until the recession ends to invest.
The market is usually forward looking by six months. If the economy recovers in 2021, then the bottom may be happen as soon as June or July.
Finally, don’t forget, the average S&P 500 stock is still down 22%. The Russell is down 28% from its peak.
Put different, is the present value of future cash flows 25% lower for the average stock? Given lower rates? Sure, 2020, and maybe 2021 cash flows will take a hit, perhaps by more than 25%. But economies with huge stimulus behind them do not stay down for long.
In the example of Akamai above, if we reduce FCF by 50% in 2021, and do not get back to a full earnings recovery until 2023, then the present value of its cash flows only drops 5%, from $84 to $80.
Of course, nothing is a bargain if your time frame is a matter of weeks or months. An investor needs an investing time horizon longer than one to two years.
Finally, I will end with better wisdom than mine.
Below is an excerpt from Oaktree's Howard Marks, out last week. His thoughts on timing market bottoms are worth reading.
Market Timing excerpt from Howard Marks Latest Memo:
Before I close, just a word on market bottoms. Some of the most interesting questions in investing are especially appropriate today: “Since you expect more bad news and feel the markets may fall further, isn’t it premature to do any buying? Shouldn’t you wait for the bottom?”
To me, the answer clearly is “no.” As mentioned earlier, we never know when we’re at the bottom. A bottom can only be recognized in retrospect: it was the day before the market started to go up. By definition, we can’t know today whether it’s been reached, since that’s a function of what will happen tomorrow. Thus, “I’m going to wait for the bottom” is an irrational statement.
If you want, you might choose to say, “I’m going to wait until the bottom has been passed and the market has started upward.” That’s more rational. However, number one, you’re saying you’re willing to miss the bottom. And number two, one of the reasons for a market to start to rise is that the sellers’ sense of urgency has abated, and along with it the selling pressure. That, in turn, means (A) the supply for sale shrinks and (B) the buyers’ very buying forces the market upward, as it’s now they who are highly motivated. These are the things that make markets rise. So if investors want to buy, they should buy on the way down. That’s when the sellers are feeling the most urgency and the buyers’ buying won’t arrest the downward cascade of security prices.'
He goes on further to say, “To insist on buying only at bottoms and selling only at tops would be paralyzing.'
Thanks for reading! I have recently launched a Marketplace service entitled Cash Flow Compounders: The Best Stocks in the World. These are high return on equity, high free cash flow stocks with a proven track record in compounding earnings at higher than market rates. There I will provide my BEST 2-4 ideas per month. My picks going back to 2011 have produced just under 30% annual returns, putting me well within the top 1% of bloggers (TipRanks). Sign up for a free 2 week trial to get my latest ideas!
----------------------------------------------------------
Disclosure: I am/we are long SPY. I wrote this article myself, and it expresses my own opinions. I am not receiving compensation for it (other than from Seeking Alpha). I have no business relationship with any company whose stock is mentioned in this article.
|213 comments | About: SPDR S&P 500 Trust ETF (SPY), Includes: DDM, DIA, DOG, DXD, EEH, EPS, EQL, FEX, HUSV, IVV, IWL, IWM, JHML, JKD, OTPIX, PSQ, QID, QLD, QQEW, QQQ, QQQE, QQXT, RSP, RWM, RYARX, RYRSX, SCAP, SCHX, SDOW, SDS, SH, SMLL, SPDN, SPLX, SPUU, SPXE, SPXL, SPXN, SPXS, SPXT, SPXU, SPXV, SQQQ, SRTY, SSO, SYE, TNA, TQQQ, TWM, TZA, UDOW, UDPIX, UPRO, URTY, UWM, VFINX, VOO, VTWO, VV